| TOP
| STORE | DSSF3
| RAE | RAD
| RAL | MMLIB
| Support | Contact
Us |
 About
this manual
  Introduction
of SA
  Reference
Manual
  Appendix
Introduction of Sound Analyzer
Sound Analyzer (SA) is an integrated data analyzing module of DSSF3. SA treats three data types: Impulse Response, Running ACF, and
Noise Measurement data. Acquired data by Realtime Analyzer (RA) or Environmental
noise Analyzer (EA) can be analyzed repeatedly by changing calculation conditions.
Analysis results are displayed on intelligible graphs and a table form. Data can be exported as the CSV format for further
analysis by other software.

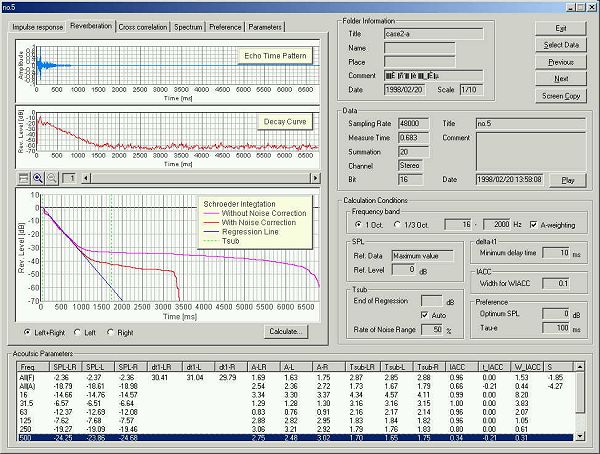
Impulse response analysis for room acoustics
Room acoustic parameters are calculated for 1/1 or 1/3 octave bands. Calculation
results for every frequency band will be displayed in graphs and numerical
table. Data can be exported as the CSV file.

Analysis features include:
- Calculation of acoustic
parameters based on Ando's Concert hall acoustics
The impulse response data is analyzed to calculate Ando's four orthogonal
parameters, sound pressure
level (SPL), initial time delay gap (delta-t1), subsequent reverberation time
(Tsub), inter-aural cross-correlation (IACC). Additional parameters such as
the Inter-aural time difference, width of IACC, A-value (reflection/direct
energy ratio) are also
calculated. These parameters are calculated in each octave band. Subjective
preference at the listening position is also calculated based on the Ando's
theory using four orthogonal factors.
- Calculation of ISO3382 room acoustic
parameters
Room acoustics parameters are calculated according to the ISO 3382
normative. Parameters are classified into four groups: 1) sound level
(Strength: G), 2) reverberation time (T20, T30, EDT), 3) balance between
early and late arriving energy (Clarity, Definition, Center time) , and 4)
binaural parameters (IACC_E and IACC_L). All of those parameters are
calculated directly from the measured impulse responses in each octave band.
- Calculation of speech transmission index
For evaluating the speech intelligibility, STI (Speech Transmission Index)
and its simplified version, RASTI (Rapid Speech Transmission Index) are
calculated based on the MTF (Modulation Transfer Function).
- Comparison of listening levels at many receiving points
When calculating the listening level in the receiving point, one data in
the same folder is considered as a reference level. When the impulse
response is measured in many points within a hall, their relative listening
level is calculated automatically. Reference level can also be set as one
measured by the sound level meter at a reference point.
- Power spectrum
The power spectrum of the impulse response represents the transfer function of the room. It is same
as the frequency characteristic of the room when is measured with white
noise as a test signal. The spectrum is displayed for each octave
band.
Running ACF/CCF for sound quality analysis
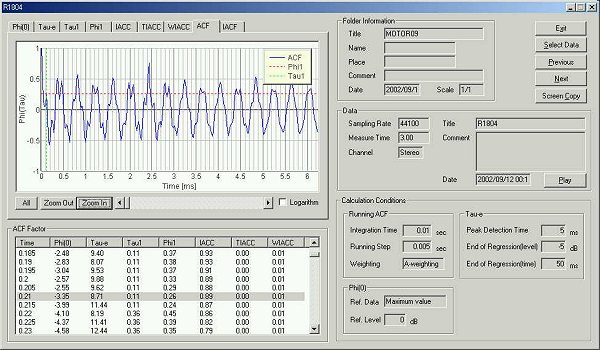
In the Running ACF (auto-correlation function) and CCF (cross-correlation
function) analysis, dynamic change of acoustic properties is calculated with
high temporal resolution. The parameters extracted from the ACF and the IACF are
strongly related to the primary sensations of sound, such as loudness, pitch,
pitch strength, sound location, and so on. Such features can be used for the
sound quality analysis of noise, diagnosis of motor and fan, medical diagnosis
of auscultation sound, or the analysis of voice quality.

Analysis features include:
- High time resolution analysis of fluctuating sound and impulsive noise
Conventional sound level meter measures sound level by two time constants,
fast: 125 ms and slow: 1.0 s. This measurement is effective for the almost
stationary sound, but is not helpful for measuring the time varying sound.
Instead, the running ACF analyzes sound in the time domain by setting two
parameters, the integration time and the running step. These parameters decide
the averaging time and the calculation interval, respectively. In this way,
temporally fluctuating sound is accurately measured. For example, 10 ms-averaged
sound level is calculated in every 1 ms. Of course, those parameters can be set
freely (between 0.001 s and 10 s) according to the target sound.
- Detailed analysis of subjective attributes of sound
Measured ACF data
by RA is saved in the measurement database, and analyzed by SA in detail with
any condition. The acoustical parameters can be calculated by the time
resolution up to 1 ms. Subjective attributes of sound, such as loudness, pitch,
pitch strength, reverberation components, and the spatial properties of sound
source, such as location, width of a source, diffuseness, are analyzed. Analysis
results are stored with its conditions, so the comparison of results is quite
easy.
- Easy comparison of amount of data
SA has a powerful graphic function
that displays the analysis results in an intelligible way. In the analysis
result display, graphs and tables for each acoustic parameter are easily
treated. For example, clicking the mark in the graph opens the data at that
point. The analysis graphs of the ACF parameters can be zoomed in/out with a
suitable time resolution for the precise display. Graphs can be saved as image
files, and tables can be saved as a text format. Such original and powerful
functions make analysis of huge amount of data very easy.
| TOP
| STORE | DSSF3
| RAE | RAD
| RAL | MMLIB
| Support | Contact
Us |
If you have questions or comments about this
page,
feel free to contact us by email ymec@ymec.com
or by online
inquiry form.


