| Japanese | English |
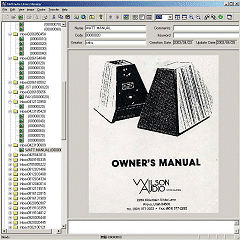 |
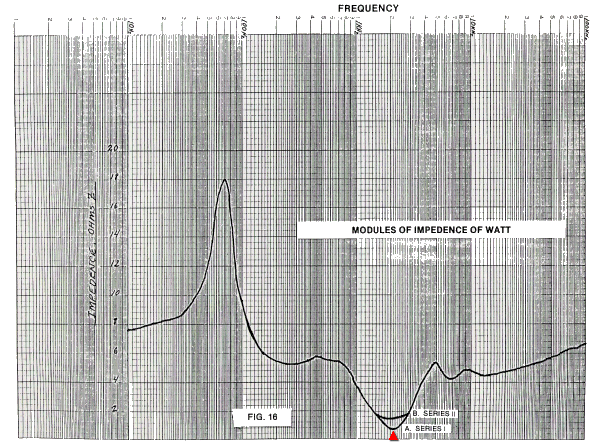
This figure is the owner's manual of Wilson Audio. Those picture files are saved by MMLIB. Screen copy of the measurement software used in this page is also made by MMLIB. |
| Date | 30 Oct. 2002 |
| OS | Windows2000 Professional |
| Software | DSSF3 |
| Hardware | Speaker: Omni-directional speaker, KENWOOD OMNI 5 Microphone: SONY ECM999 Microphone amplifier: TASCAM DA-P1 (DAT) Notebook PC (signal generator) : SONY VAIO PCG-R505R Notebook PC (Analyzer) : DELL INSPIRON7500 |
| Test source | Pink noise signal CD (published by YMEC): Pink noise is used. DP-90 CD
transport. DENON NEW AUDIO CD (COCO-6334): White noise is used. |
| Audiovisual apparatus | Power amplifier: Accuphase A-50 Pre-amplifier: Accuphase C-290 CD transport: Accuphase DP-90 Digital processor: Accuphase DC-91 |
WILSON AUDIO TINY TOT
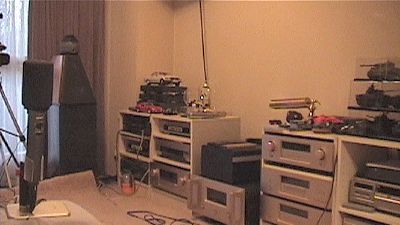

This loudspeaker system is tuned up to obtain the excellent transient stability by using the QB3 alignment. Supra low frequency extension is realized by the subwoofer Puppy 3. Its impedance is 4Ω for 200Hz-100kHz and 1Ω for 1 kHz. This is the reason why this system needs a high grade amplifier.
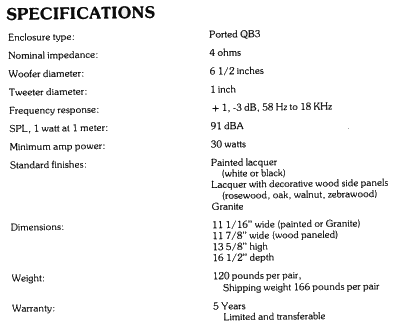
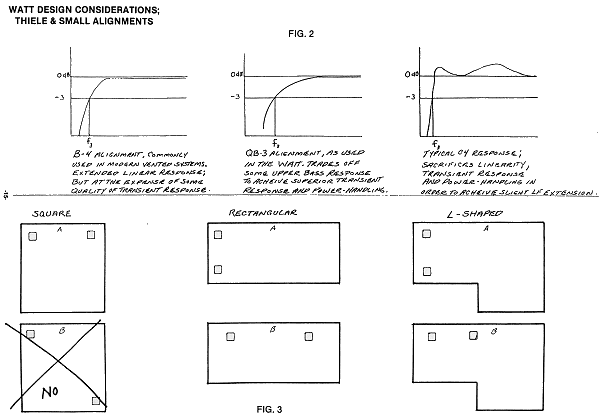
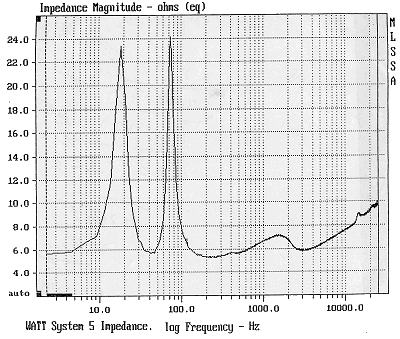
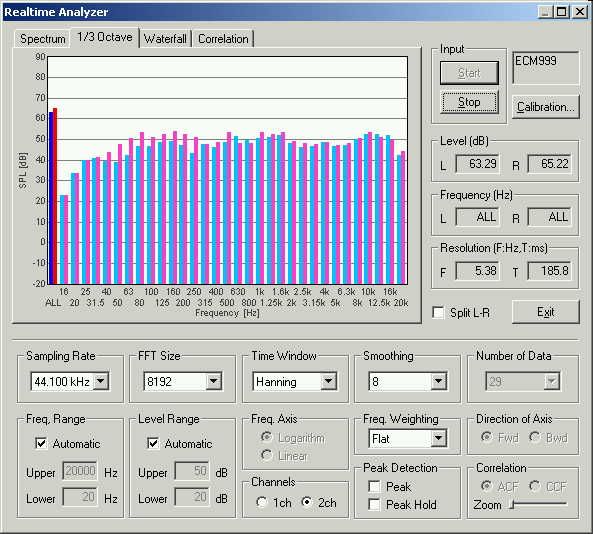
The compensated microphone is used for the measurement since "Audio measurement report 4" Only the analog amplifier of the sound card of a personal computer is not compensated. In this measurement, the frequency response of the speaker is checked by the octave band analysis with a pink noise. Also, the oscilloscope is used to check a speaker output of very low (30 Hz) and high frequency (18 kHz) sinusoids.
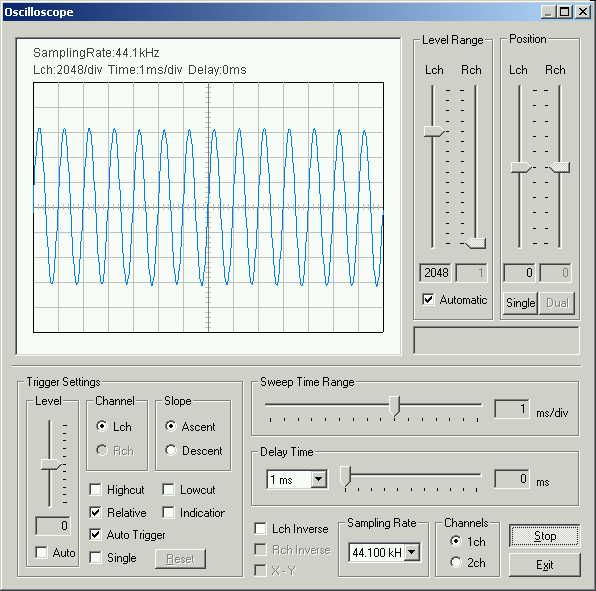
This is an oscilloscope monitor of 1 kHz tone in Inspiron (analyzing system).
Pink noise was generated in SONY VAIO (generating system), and recorded in Inspiron. It is the frequency response of a speaker. But actually, the performance of the analog amplifier of VAIO and the sound characteristic of the room have influenced.
This figure shows the frequency response of the VAIO's amplifier. It was measured in "Directions for full-fledged use 1".
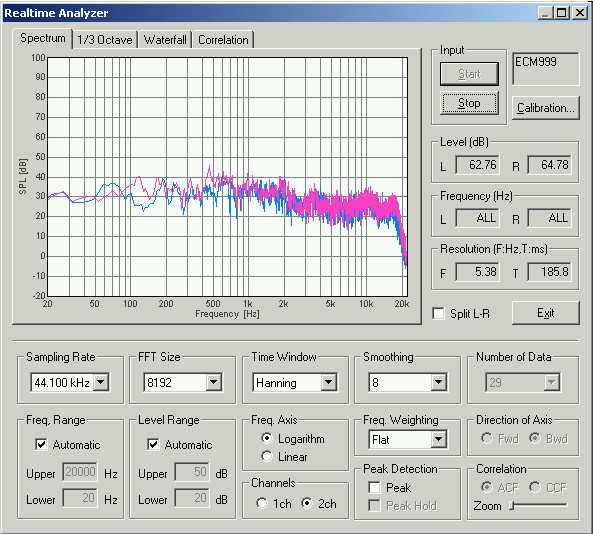
This is a power spectrum measured for a white noise. Frequency axis is logarithmic.
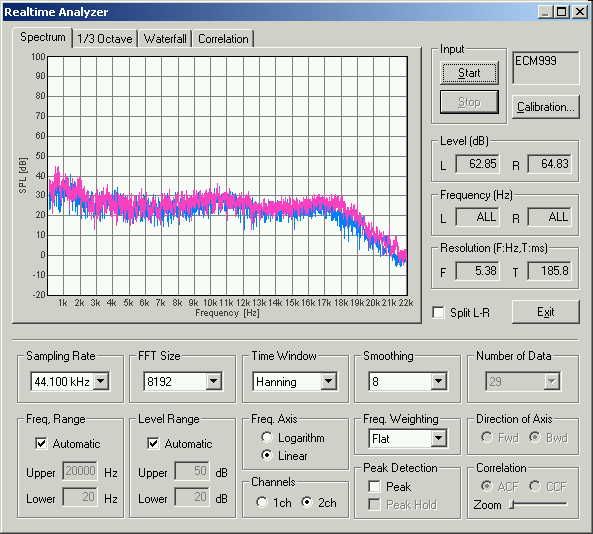
This is also a power spectrum measured for a white noise. Frequency axis is linear.
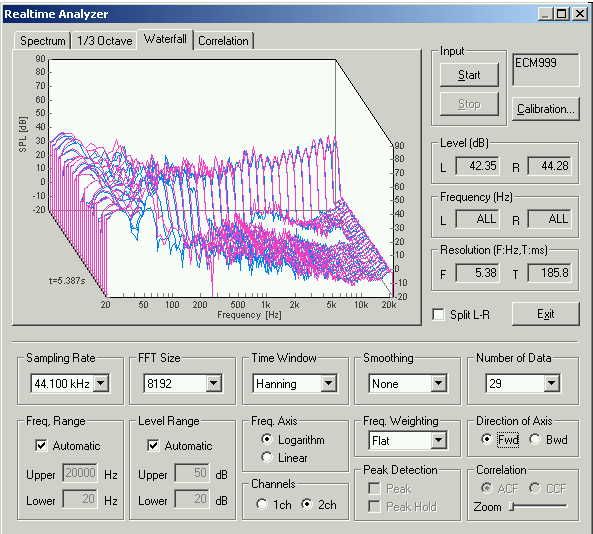
This is a 3D display of a spectrum. Sweep signal between 20 and 20000 kHz was generated at 1.8 Oct/s.
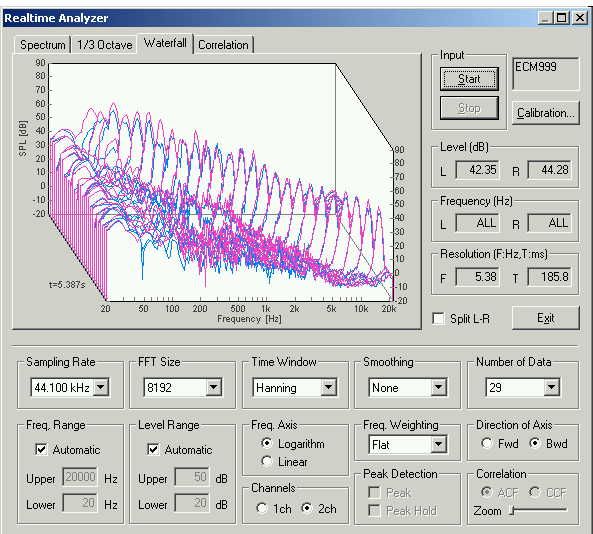
This is the same analysis as above figure, but the time axis is inverted. It shows that the response is good for all frequency range.
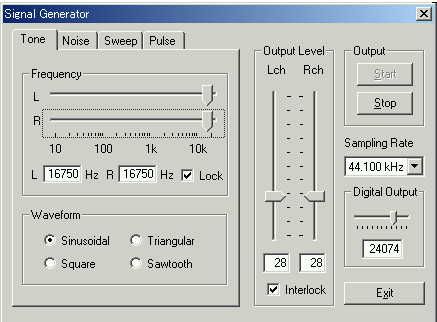
In VAIO (sound generator), a 18 kHz sine wave is generated by the signal generator.
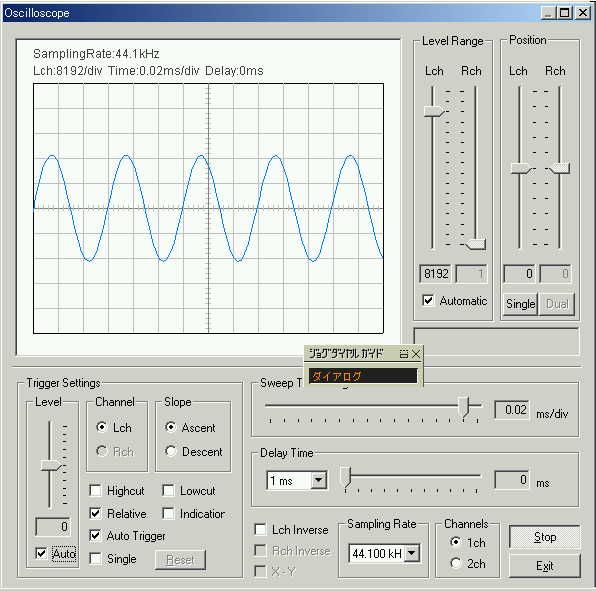
This is the monitor of the waveform in the exit of a mixer of VAIO. A test signal is inputted into LINE2 of Accuphase C290 preamplifier via a mixer, an analog amplifier and a headphone output terminal. Then, WATT speaker connected with A50 power amplifier is sounded.
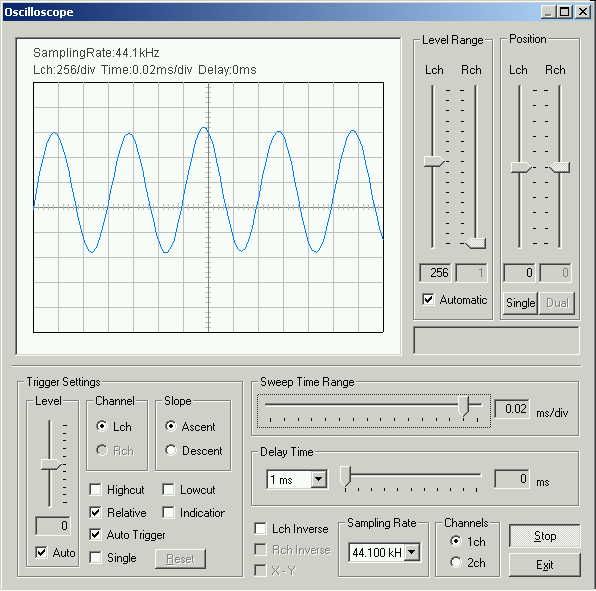
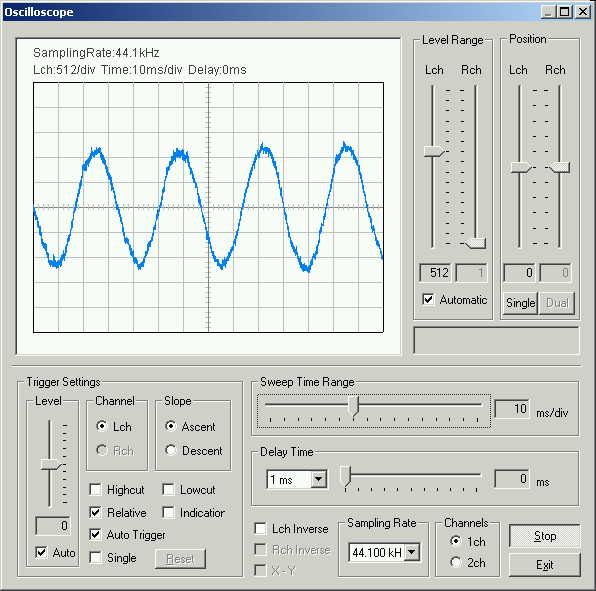
This is the monitor of the waveform in Inspiron (analyzer). The sound of a WATT speaker was recorded from the LINE IN terminal of Inspiron via SONY ECM-999 microphone and TASCAM DAT microphone amplifier. Peak level meter indicates 70dB, but ear hardly hears it.
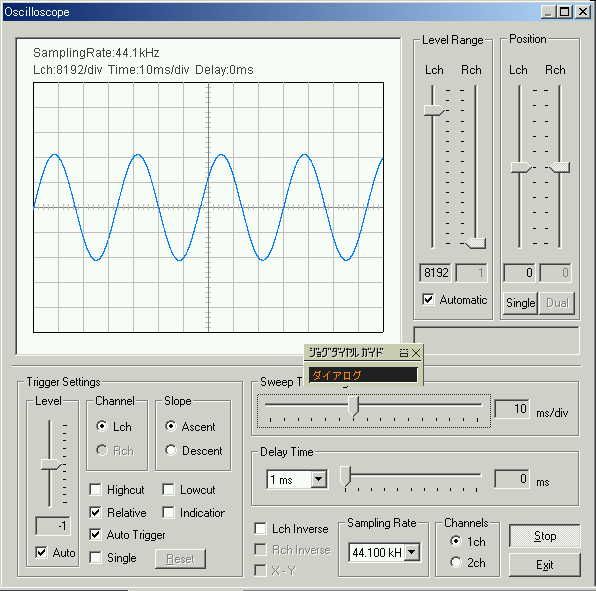
In VAIO (sound generator), a 30 Hz sine wave is generated by the signal generator.
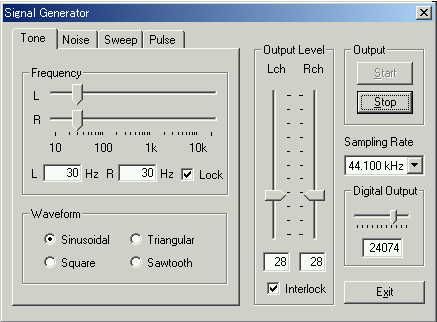
This is the monitor of the waveform in VAIO.
This is the monitor of the waveform in Inspiron (analyzer). Energy of the low frequency sound is realized in this measurement.
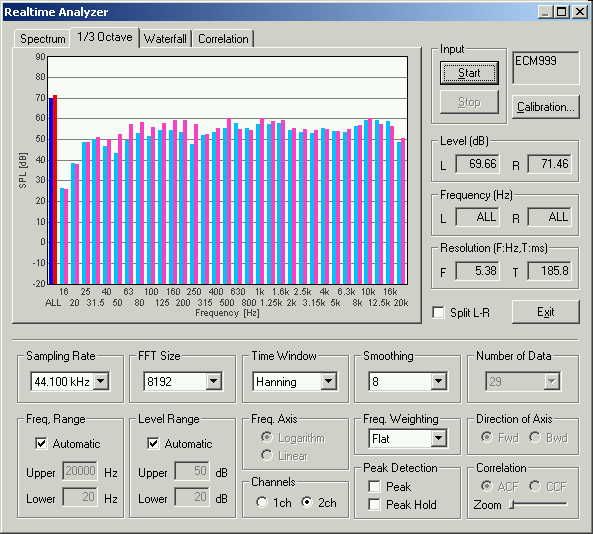
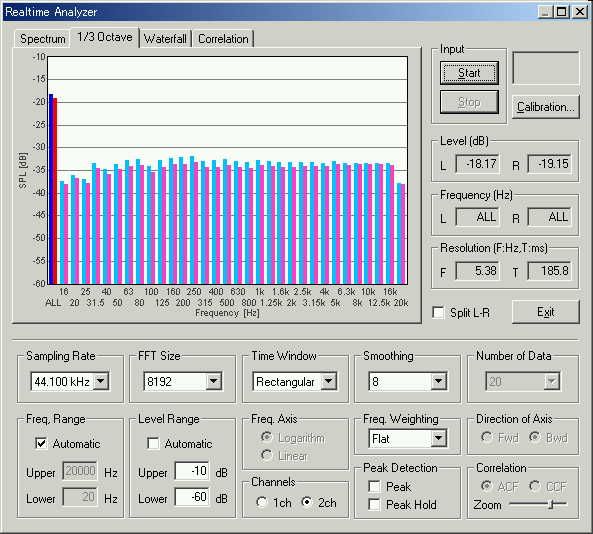
This is a 1/3 octave analysis of a pink noise. It is influenced by the characteristic of the room (a certain frequency is strengthened, and a certain frequency is weakened). So ideally, the measurement in the anechoic room is required.
This time the waveform was also checked with the oscilloscope. The feature of WATT was not found particularly. No problems are found. Since the frequency range is large, it is likely to be useful for the evaluation of various software and audio equipment.
The high-end audio is now developed in consideration of its time characteristic. High resolution analysis is required on the time-axis for the response of a speaker to a sound signal.
April 2003 by Masatsugu Sakurai