| RA FEATURES |
| | Japanese | English | |
In RA (Real time Analyzer), sound data is analyzed and displayed in real time. Acoustic signal and electronic signal are inputted / outputted, displayed and recorded. RA is a Windows application, so it works with other software at the same time. Measurement results are processed by other software, for making documents, presentation, image editing, graph display, print, and statistical processing.
RA's signal input / output
RA works on any standard PC with Windows OS. Just install RA to start the measurement.
Detailed description
When measuring sound, the analog signal is first converted to the digital signal in the soundboard. Then, the digital signal is put in the mixer device in Windows and is taken in to RA. See the figure below. Test signals created in RA's signal generator passes the same course in the opposite direction. Windows' sound control program (volume control) is used to select the input / output device and to adjust the volume. This is a standard function of Windows, so just install RA to start the measurement.
Signal output
RA outputs the test signal in a same manner as Windows does.
Detailed description
Selection of the output device is a same operation as in Windows. When the sound is output from the loudspeakers, RA outputs the digital signal (WAVE signal) to the Windows sound mixer. Output volume is adjusted by the Windows volume control. To output the sound to external devices (e.g. amplifier), select "line" as the output device in Windows volume control.
Adjustment of output volume is done by Windows volume control. Output volume of the signal is adjusted on the Windows volume control and PC's hard volume. Another important function to control the output volume is "Digital Output" in the signal generator. This is an original function of RA. This volume adjusts the range of the digital signal, to make the signal not to be distorted. It is important to remember that many soundboards' performance becomes poor around their maximum output level.
Signal input
RA inputs sound and electronic signals in a same manner as Windows does.
Detailed description
Selection of the input device is a same operation as in Windows. To measure the sound and other signals by RA, selection of the soundcard and other input device, volume control, and combination of several input devices are controlled in Windows volume control.
Operation of the input microphones is same as in usual sound recording. Usually, "line" is used as the input device. If your PC does not have the line-in terminal, use the microphone input terminal. Alternatively, a soundcard with USB interface is available. Adjustment of the input volume is done by the Windows volume control or by the volume control in RA's main window. These two controls are interlinked for ease of use.
Basic measurement procedure
Input sound can be listened to, be displayed and measured at the same time.
Detailed description
For the measurement of the performance of audio devices, input the test signal (by use of the signal generator) to the device and measure its output by the oscilloscope or the FFT analyzer.
Measurement results can be saved as a picture file by using the Windows screen copy function (Alt + PrtScr). Our image database software, Mmlib is also convenient.
WAVE file, CD
Signal generator's output can be saved as a wav format in the hard disk or in the CD. Then, these files can be used as test signals instead of the signal generartor.
Microphone calibration
For the measurement of the absolute sound level, an input level sensitivity can be calibrated. The sound level meter or the acoustic calibrator can be used for the calibration. Microphone's frequency response can also be compensated on the RA's calibration window, if you have the data provided from the manufacturer. This compensation is useful if you are measuring the frequency response of the audio device, such as the amplifier and the loudspeaker.
Purpose of the measurement
RA is used for checking the audio device's operation, diagnosing, and evaluating its performance.
Basic measurement procedure
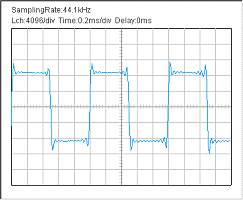
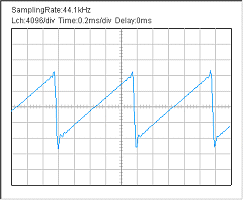
Measurement by the signal generator and the oscilloscope: In the signal generator, four kinds of waveforms (sinusoidal, triangle, square, sawtooth) are created with an arbitrary frequency. The oscilloscope can display the waveform of the signal. By measuring the output of the device (e.g. amplifier), you can measure whether the signal is correctly amplified, or whether the signal is distorted or not.
Measurement by the signal generator and the FFT analyzer (spectrum, octave band, waterfall, correlation): FFT analyzer is a powerful tool for measuring sound in real time. Spectrum, 1/3 Octave, Waterfall, and Correlation analyzer can be used with the signal generator as follows.
Tone
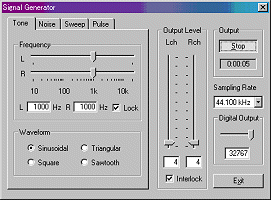
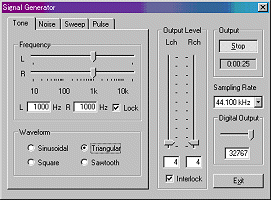
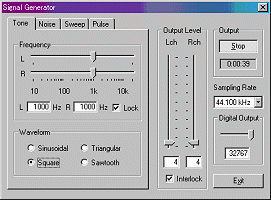
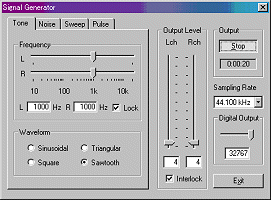
In the signal generator, four kinds of waveforms (sinusoidal, triangle, square, sawtooth) are created. Its frequency is set by entering the numerical values, by moving the slider, or by choosing from presets. Tone is used to test the performance of the audio devices, by listening to the signal, or by measuring the output from the device to see how the signal is changed when the signal goes through the device. The oscilloscope and the FFT analyzer are very effective tools for this kind of measurement.
This is a very important measurement from which the proper operation of the audio device is checked. It is very effective for the diagnosis and maintenance of devices. Abnormalities such as distortion, oscillation, noise, are easily detected.
Using the real time cross-correlation meter, time delay between the channels is measured. By this measurement with changing frequency with a slide bar, dynamic properties of the frequency characteristic of delay time can be checked.
Noise
White noise contains equal energy for all frequency, so its power spectrum is flat. By the white noise and the power spectrum, the frequency response of the audio devices is easily measured. Connect the PC's output (line) to the external device and measure the output of the device by the spectrum analyzer. Using the real time cross-correlation meter, time delay between the channels in all frequency range is measured.
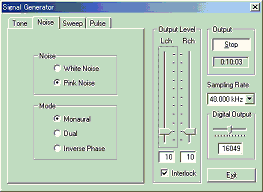
Pink noise is similar to white noise, but the energy decreases in relation to its frequency. In audio measurement, pink noise is more popular than white noise, because white noise is sometimes dangerous for loudspeakers due to its high energy in the high frequency ranges. To measure the frequency response by use of the pink noise, the 1/3 octave band analysis is used. The octave band spectrum of pink noise becomes flat. Using the real time cross-correlation meter, time delay between the channels in all frequency range with the pink noise filter is measured.
Sweep
Sweep is a tone signal of which frequency is continuously varied. It is generated with arbitrary start and end frequencies, sweeping speed, and waveform. Frequency response of the sweep signal is same as pink noise. By measuring the output of the sweep signal by the 1/3 octave band analyzer, dynamic characteristics of the device are clearly visible. The combination of the sweep signal and the waterfall measurement (three dimensional display of time, frequency, and energy) is a useful tool for checking the dynamic characteristic of loudspeakers. It is quite effective for measuring the dynamic characteristics of the loudspeaker including the crossover network. Using the real time cross-correlation meter, time delay between the channels in the sweep signal is measured.
Multi-functional sound level meter
In the FFT analyzer, sampling frequency, FFT size, time window shape, and frequency weighting filters (Flat, A, B, C) are easily chosen. The spectrum analyzer and the octave band analyzer are equipped with the peak hold function and the smoothing function including the standard time constant of slow: 1.0 s and fast: 0.125 s. Also, the microphone calibration function is available. By setting these conditions properly, the FFT analyzer can be used as a highly advanced multi-functional sound level meter.
Signal generator |
Oscilloscope |
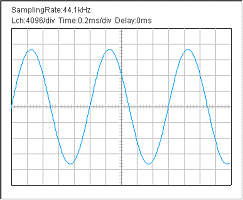
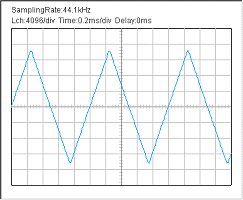
Signal generator can create a sound signal with
various waveforms: sinusoidal, triangular, square, and sawtooth. Created
waveform can be checked simultaneously by using the oscilloscope.
|
|
 |
 |
||
 |
 |
||
 |
 |
Signal generator 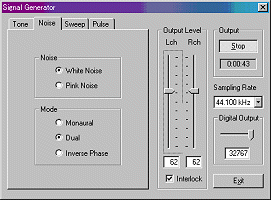 |
Spectrum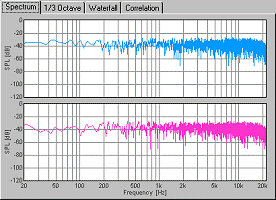 |
By using the noise generator and the power
spectrum, frequency response of the audio equipments are easily measured.
See Measurement of the frequency characteristics of a loudspeaker |
|
Signal generator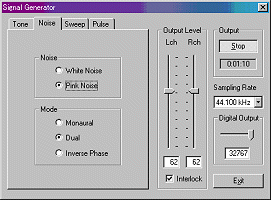 |
1/3 octave band analysis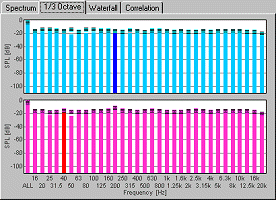 |
1/3 octave band analyzer is equipped with a
peak hold function and frequency weighting filters (Flat, A, C).
Combination of pink noise and 1/3 octave band analysis is also used for
the measurement of the frequency response of audio equipments.
By calibrating microphones, RAL can also be used as 2ch precision sound level meter. |
|
Signal generator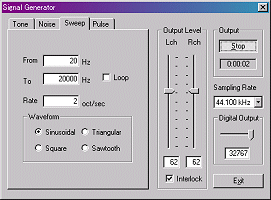 |
Waterfall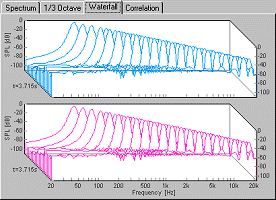 |
Signal generator can also generate a sweep or pulse signal. Waterfall display with a sweep signal is a very useful measure for the crossover network of the loudspeaker. | |
 |
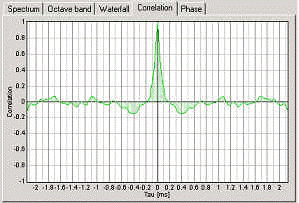 |
Correlation meter is very useful for measuring
the phase between two channels.
|
Microphone calibration
For the measurement of the absolute sound level, an input level sensitivity should be calibrated. The sound level meter or the acoustic calibrator can be used for the calibration. It is important that a wide dynamic range and a high S/N ratio are obtained. So the calibration should be done by increasing the input level as much as possible with the expected sound level in the actual measurement. If necessary, make several different calibration data for different input sound level.
Microphone's frequency response can also be compensated on the RA's calibration window, if you have the data provided from the manufacturer. This compensation is useful if you are measuring the frequency response of the audio device, such as the amplifier and the loudspeaker. But note that the compensation of the frequency response is sometime harmful, especially for the recording and the measurement of the transient signals (music, speech). In that case, the transient response would be more important than the frequency response. Because the frequency response compensation might distort the transient response, it is NOT recommended to use it except for the frequency response measurement by using the stationary test signals (white noise or pink noise).
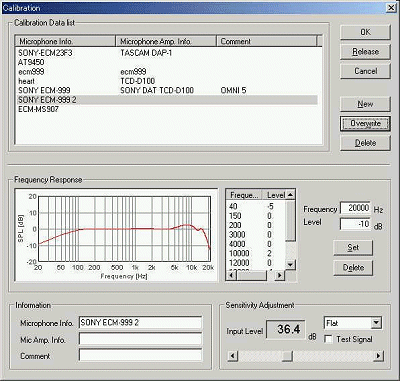 |
In this example, the frequency response curve of Sony
ECM-999 is edited, before the measurement of the loudspeaker's frequency
response. This microphone covers a wide frequency range and a wide dynamic
range. By compensating the frequency curve, more accurate measurement
would be possible.
For more information, see RA's operation guide, Introduction to sound measurement |
Note: Functions below are not available in RAL. Use RAD, RAE, or DSSF3.
Impulse response
In RA, the impulse response is measured by the simultaneous input and output of the MLS signal. Sampling rate, measurement time, and measurement channel (monaural or stereo) can be specified. Measured impulse response can be saved as a wav format or a text format. Output signal and input signal themselves can also be saved. Measurement data is managed in the common database in RA and SA.
From the measured impulse response, the important room acoustics parameters are easily analyzed by SA. Sound level, initial time delay gap between the direct and the reflected sound, reverberation time, and IACC are calculated for each 1/1 or 1/3 octave band. The impulse response is also used for the auralization (virtual acoustic reality) and the variety of sound effects, by using the well established convolution techniques.
Compensation of the loudspeaker and the microphone's response (frequency response and dynamic response) is possible by using the "inverse filter" function. It can be set at the time of measurement. Compensation of the frequency response of the microphone is also available.
Measurement data at many positions in a concert hall are easily managed by use of RA and SA. At the time of measurement by RA, the measurement conditions are recorded automatically in the database.
Sound level is calculated as a relative level within a data folder, by specifying one data (or the maximum level) as a reference level.
RA is equipped with the measurement supporting functions for beginners. In the "Auto Retry" mode, measurement is repeated twice and the accuracy of the measurement is checked by comparing with the test measurement result. By using this function, measurement is repeated until the correct data is obtained. This is a very important function to make a measurement reliable.
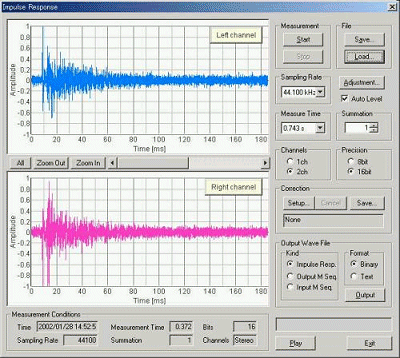 |
Acoustical properties of a room are calculated from the
impulse response. Measured impulse response is also used for simulating
the sound field of the concert hall or the theater.
Octave band or 1/3 octave band analysis is available. Sound level, reverberation time, and IACC are calculated for each frequency band. Noise compensation of the reverberation curve is available. Analysis result is displayed in a graph and exported as a csv format. See the impulse response measurement guide in the program manual, Introduction to sound measurement. |
Running ACF
Conventional sound level meter measures sound level by two time constants, fast: 125 ms and slow: 1.0 s. Octave band analyzer measures the averaged sound levels in each frequency band. These methods are effective for the almost stationary sound, but are not helpful for measuring the time varying sound.
Instead, the running ACF measurement analyzes sound in the time domain by setting two parameters, integration time and running step. These parameters decide the averaging time and the calculation interval, respectively. In this way, temporally fluctuating sound is accurately measured. For example, averaged sound level of 0.5 s is calculated in every 0.2 s. Of course, those parameters can be set freely (between 0.001 s and 10 s) according to the target sound. In RA, the measured running ACF is displayed as a 3D graph.
Measured ACF data is saved in the measurement database, and analyzed by SA in detail with any condition. The acoustical parameters can be calculated by the time resolution up to 1 ms. Subjective attributes of sound, such as loudness, pitch, pitch strength, reverberation components, and the spatial properties of sound source, such as location, width of a source, diffuseness, are analyzed. Analysis results are stored with its conditions, so the comparison of results is quite easy.
Furthermore, SA has a powerful graphic function that displays the analysis results in an intelligible way. In this analysis result display, graphs and tables for each acoustic parameter are easily treated. For example, clicking the mark in the graph opens the data at that point. The analysis graphs of the ACF parameters can be zoomed in/out with a suitable time resolution for the precise display. Graphs are saved as image files, and tables are saved as a text format. Such original and powerful functions make analysis of huge amount of data very easy.
High analysis capability and user-friendly interface are the great features of RA and SA's running ACF measurement. This covers a wide range of application, such as the sound quality analysis of noise, diagnosis of motor and fan, medical diagnosis of auscultation sound, or the analysis of voice quality.
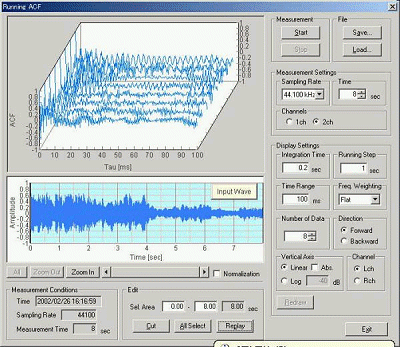 |
In the running ACF measurement, the integration time of
sound and the calculation interval can be set. For example, 0.2 s of the
integration time and the 1 sec of the calculation interval means that the
sound level is averaged for 0.2 s for every 1 sec. Measurement result is
displayed as a three dimensional graph.
See the Running ACF measurement guide in the program manual, Introduction to sound measurement. |