| Japanese | English |
| Date: | 12:00, 30 Sep. 2002 |
| Place: | Nagoya, Japan |
| Microphone: | SONY ECM-MS957 |
| Amplifier: | SONY DAT WALKMAN TCD-D100 |
| Personal computer: | DELL INSPIRON 7500 |
| OS: | Windows 2000 Professional |
| Software: | DSSF3 |
| WAVE sound file: |
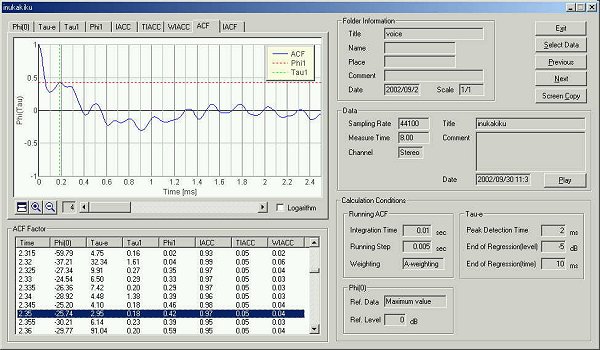
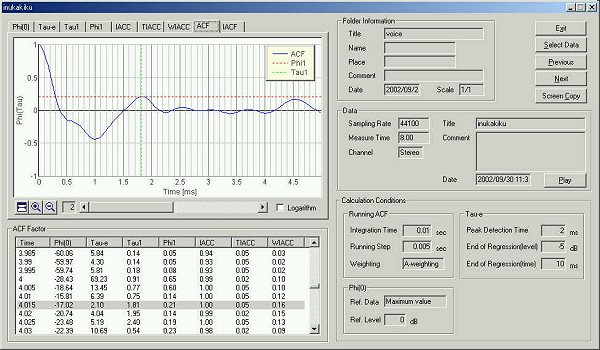
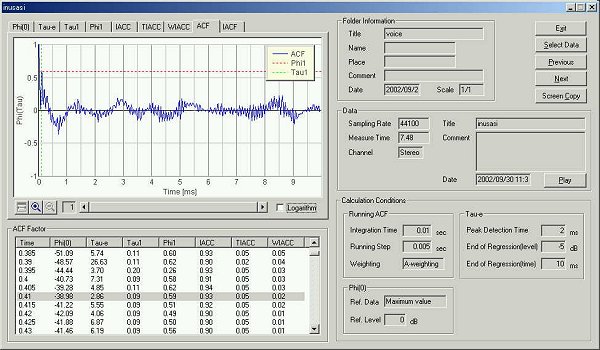
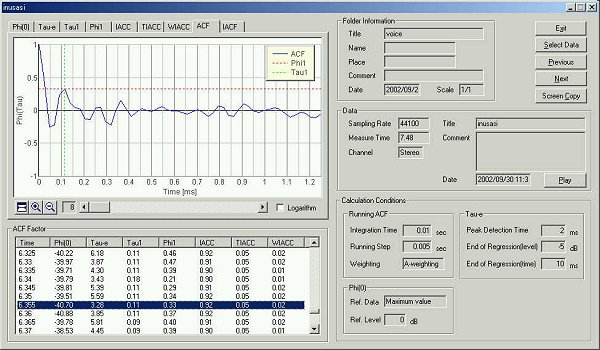
This is the calculation conditions of SA.
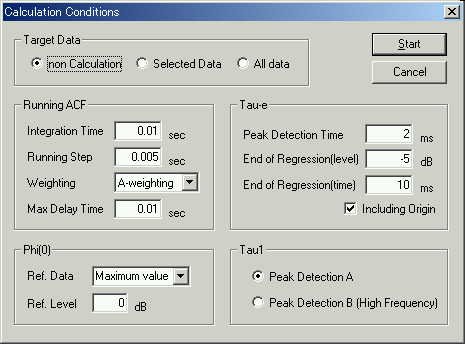
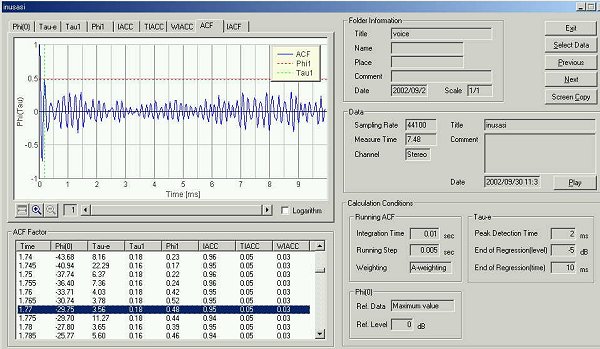
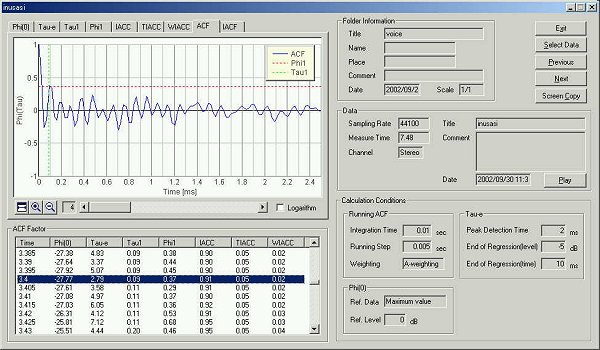
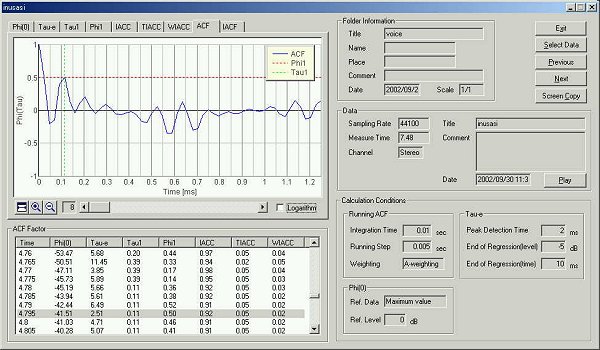
As in the last time, the ACF of which te value is the minimum is shown later.
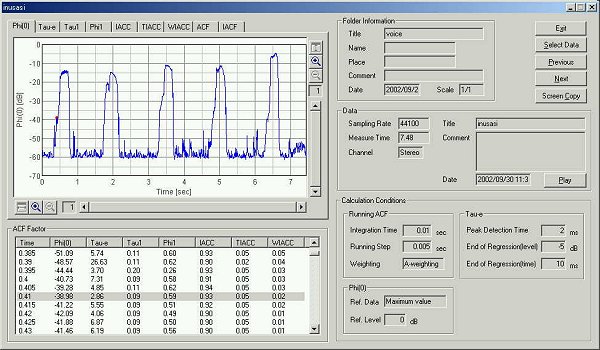
The graph below shows the time change of the sound level. Five utterances of
"ka, ki, ku, ke, ko" can be seen.
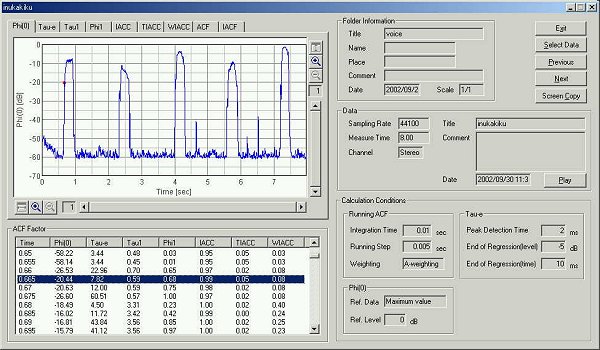
Even though the same syllable "ka" is pronounced, there are many
ways of utterances. Especially the Japanese language has different word with the
same pronunciation. So, many templates are required for one syllable.
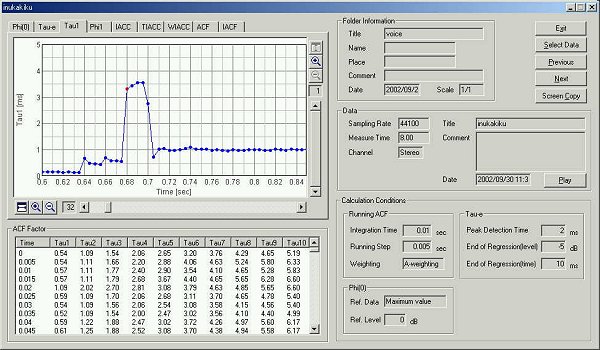
The new function is the zoom in/out display for each parameter graph.
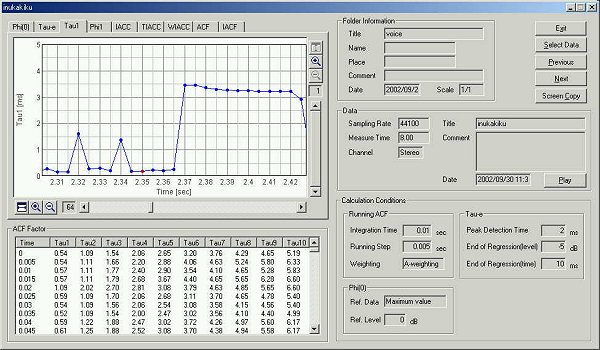
This is the time change of the t1
value. The utterance "ka" began at 0.64 seconds. Generally, finding
the start/end point of the utterance is difficult in the speech analysis. But
using this graph, we can catch the utterance correctly.
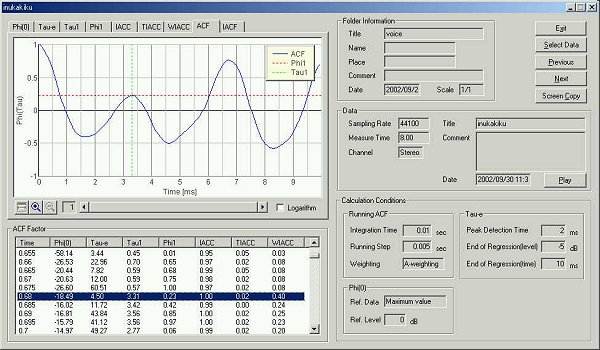
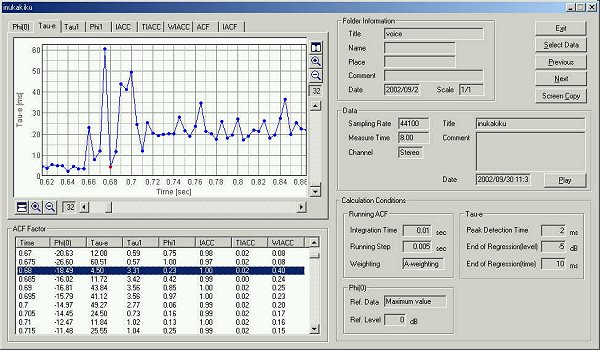
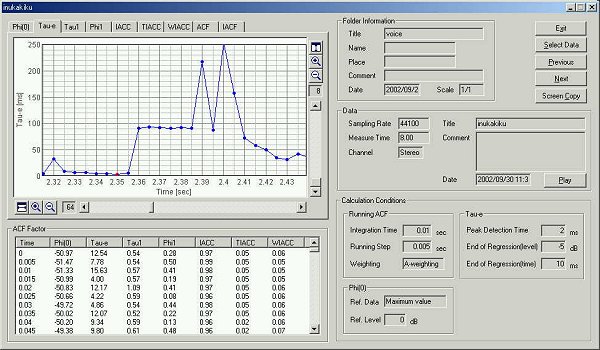
This is the time change of the te
value. The utterance began at 0.64 seconds.
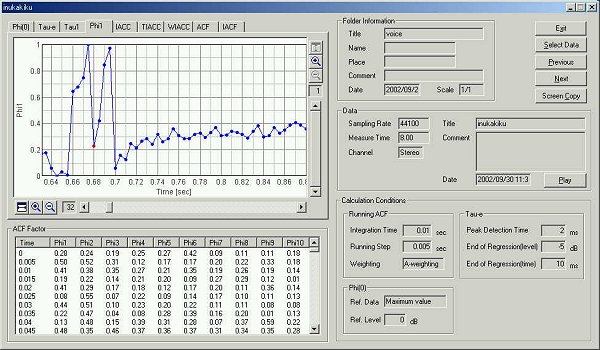
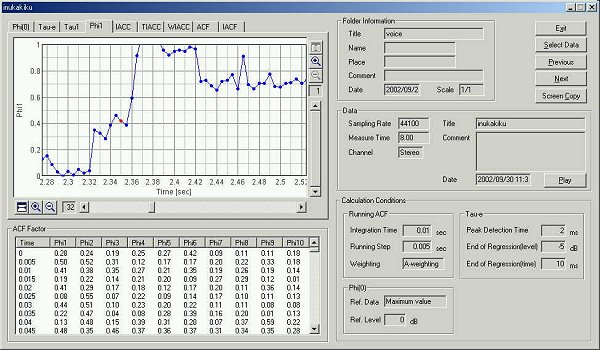
This is the time change of the f1
value.
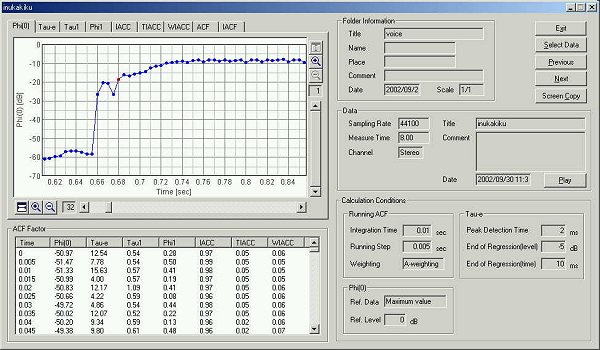
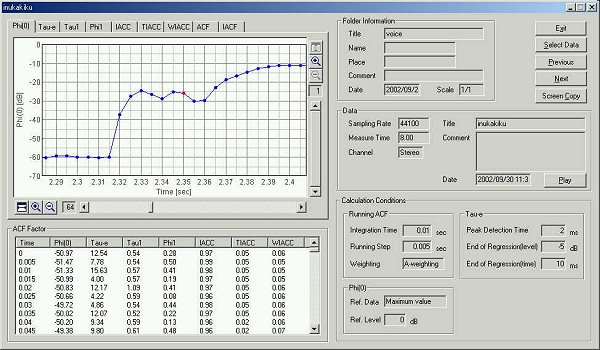
This is the time change of the F(0) value.
This is the graph of t1.
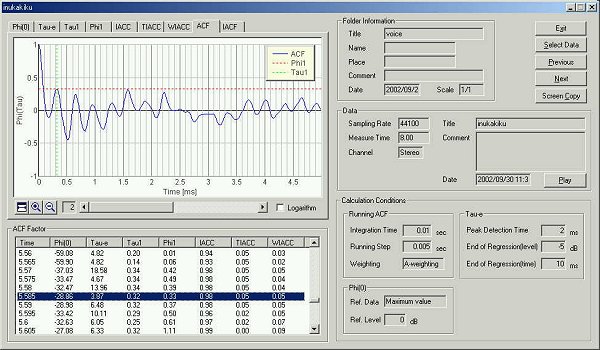
This is the graph of te.
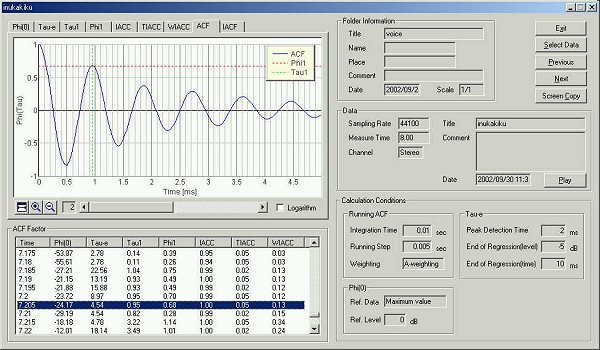
This is the graph of f1.
This is the graph of F(0).
Next, another five utterances "sa, si, su, se, so" were measured. The graph shows time change of sound level.
The four parameters are almost same values as previous analysis.
In the table below, the data analyzed is summarized.
| time (ms) | utterance(ms) | t1(ms) | f1 | te(ms) | |
| a tune do | 0.625 | 35 | 1.13 | 0.27 | 6.80 |
| a tune re | 2.040 | 10 | 1.22 | 0.32 | 4.30 |
| a tune mi | 3.575 | 20 | 1.20 | 0.32 | 6.27 |
| a tune fa | 5.075 | 20 | 1.22 | 0.38 | 4.94 |
| a tune so | 6.605 | 25 | 1.20 | 0.66 | 7.76 |
| a tune ra | 8.140 | 5 | 1.18 | 0.49 | 6.45 |
| a tune si | 9.650 | 10 | 1.30 | 0.30 | 4.91 |
| a tune do | 11.255 | 20 | 1.25 | 0.50 | 4.45 |
| a vowel compare | 5 | 1.18 | 0.44 | 3.98 | |
| I | 10 | 0.27 | 0.97 | 6.78 | |
| u | 10 | 2.18 | 1.00 | 5.05 | |
| e | 15 | 0.29 | 0.50 | 15.48 | |
| o | 15 | 1.18 | 0.35 | 21.80 | |
| a | 25 | 1.20 | 0.45 | 8.46 | |
| ka | 10 | 1.86 | 0.46 | 6.26 | |
| sa | 60 | 0.09 | 0.64 | 2.48 | |
| ta | 10 | 1.93 | 0.43 | 5.07 | |
| na | 25 | 4.35 | 0.98 | 21.94 | |
| ha | 40 | 0.70 | 0.16 | 3.22 | |
| ma | 15 | 4.08 | 1.00 | 8.86 | |
| ya | 15 | 0.11 | 1.00 | 10.09 | |
| ra | 20 | 2.59 | 0.18 | 7.29 | |
| wa | 5 | 0.25 | 0.69 | 7.42 | |
| ka | 40 | 3.31 | 0.23 | 4.50 | |
| ki | 35 | 0.18 | 0.42 | 2.95 | |
| ku | 20 | 1.81 | 0.21 | 2.10 | |
| ke | 20 | 0.32 | 0.33 | 3.87 | |
| ko | 40 | 0.70 | 0.16 | 3.22 | |
| sa | 25 | 0.09 | 0.59 | 2.86 | |
| si | 50 | 0.18 | 0.48 | 3.56 | |
| su | 110 | 0.09 | 0.37 | 2.79 | |
| se | 30 | 0.11 | 0.50 | 2.51 | |
| so | 60 | 0.11 | 0.33 | 3.28 |
There are various pronunciations for the same character. A character can be told with a sound, but a sound is not told in a written form. The more it becomes intellectual and advanced communication, the more audio analysis may be difficult.
October 2002 by Masatsugu Sakurai