| Japanese | English |
| Date: | 12:00, 30 Sep. 2002 |
| Place: | Nagoya, Japan |
| Microphone: | SONY ECM-MS957 |
| Amplifier: | SONY DAT WALKMAN TCD-D100 |
| Personal computer: | DELL INSPIRON 7500 |
| OS: | Windows 2000 Professional |
| Software: | DSSF3 |
| WAVE sound file: |
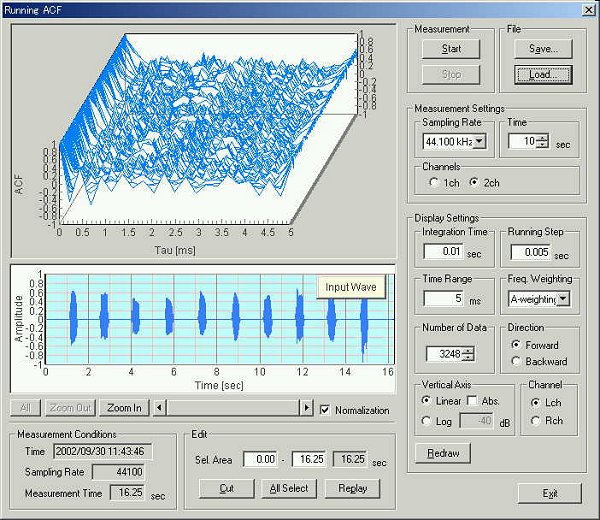
In the combination of a consonant and a vowel, a frequency characteristic at certain moment is not meaningful. The power spectrum is not displayed. Only the autocorrelation is measured later.
This is the calculation condition window of SA.
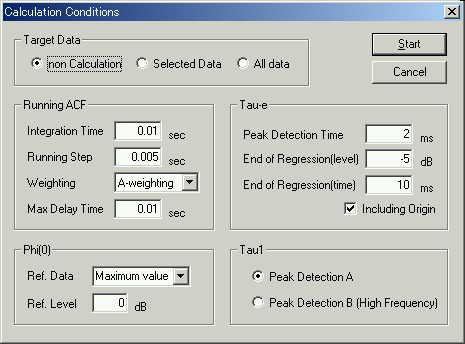
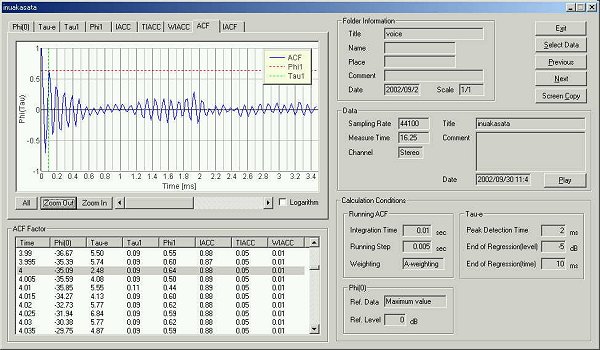
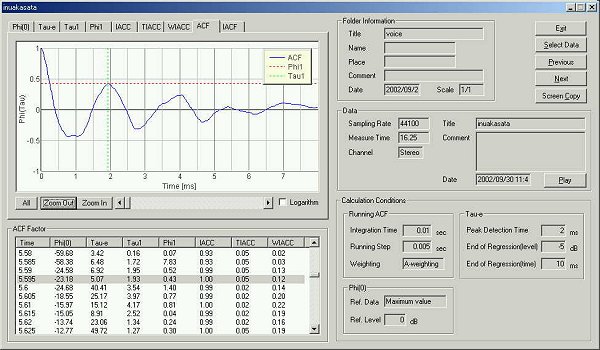
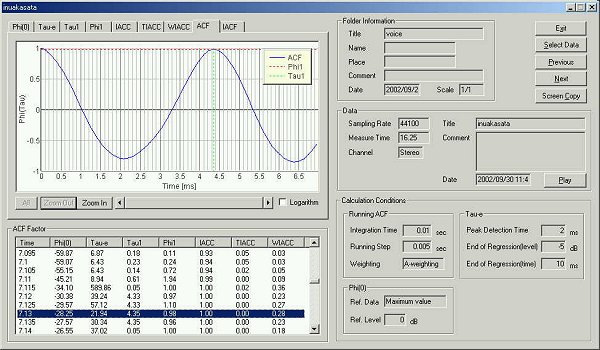
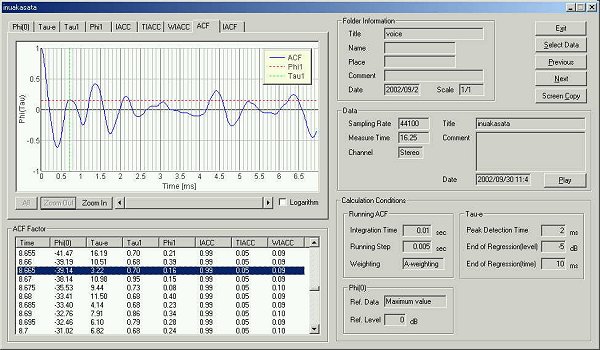
In the following, only the ACF in which the te value becomes minimum is considered. It is because the most information is included at this time.
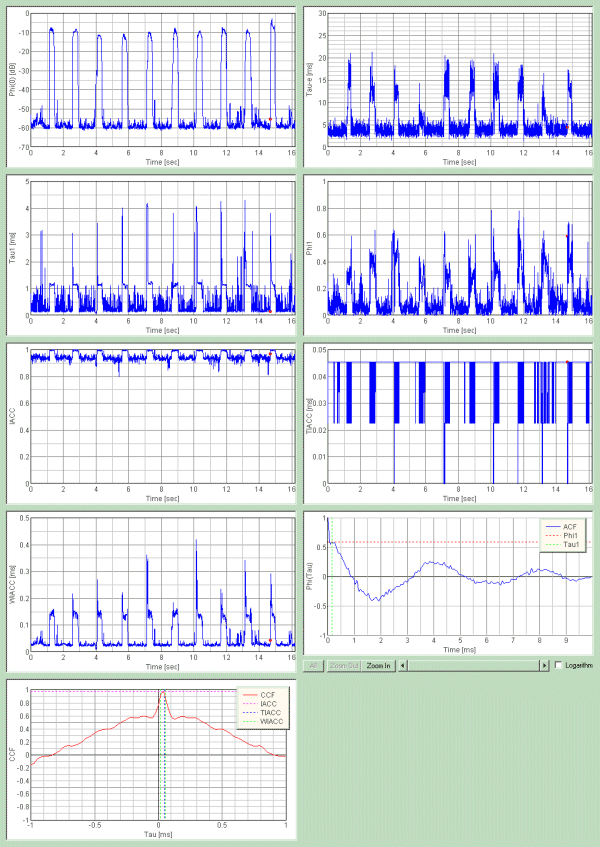
This is the time change of the sound level. Ten utterances can be seen.
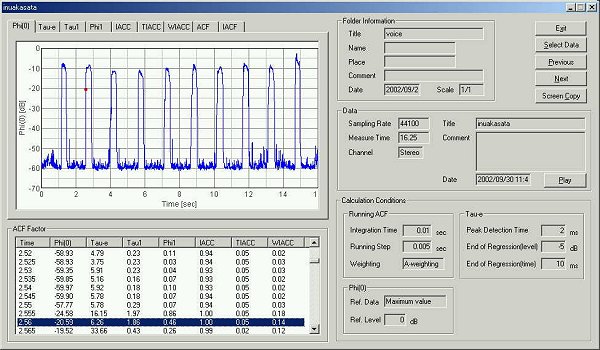
Result of "a" is not shown here. See the previous report.
| "Ka"
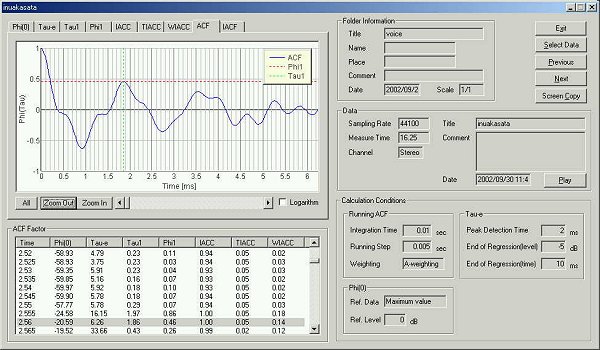
2.56 second after measurement start, 10msec after utterance start t1=1.86msec / f1=0.46 / te=6.26msec / F(0)(SPL)=-20.59dB |
At 10 ms after the utterance starts, the low frequency components are not
analyzed yet. Most information is included at this time. That is the reason why
this point is chosen for the analysis.
| "Sa"
4 second after measurement start, 60 msec after utterance start t1=0.09msec / f1=0.64 / te=2.48msec / ƒ³(0) (SPL)=-35.09dB |
| "Ta"
5.595 second after measurement start, 10 msec after utterance
start t1=1.93msec / f1=0.43 / te=5.07msec / ƒ³(0) (SPL)=-23.18dB |
| "Na"
7.13 second after measurement start, 25 msec after utterance
start t1=4.35msec / f1=0.98 / te=21.94msec / ƒ³(0) (SPL)=-28.25dB |
| "Ha"
8.665 second after measurement start, 40 msec after utterance
start t1=0.7msec / f1=0.16 / te=3.22msec / ƒ³(0) (SPL)=-39.14dB |
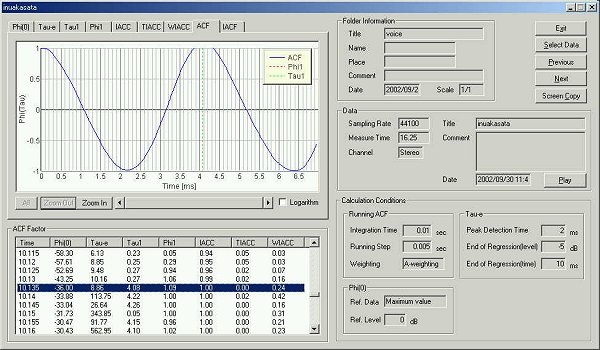
| "Ma"
10.135 second after measurement start, 15msec after utterance
start t1=4.08msec / f1=1 / te=8.86msec / ƒ³(0) (SPL)=-36dB |
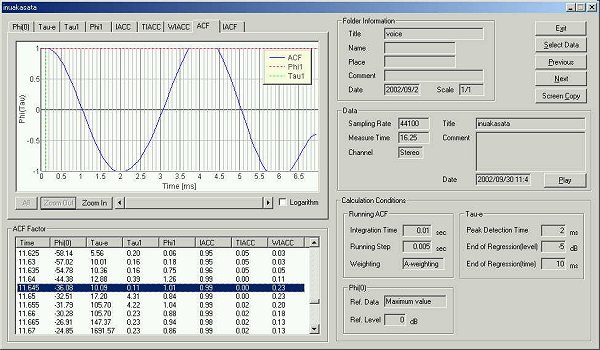
| "Ya"
11.645 second after measurement start, 15msec after utterance
start t1=0.11msec / f1=1 / te=10.09msec / ƒ³(0) (SPL)=-36dB |
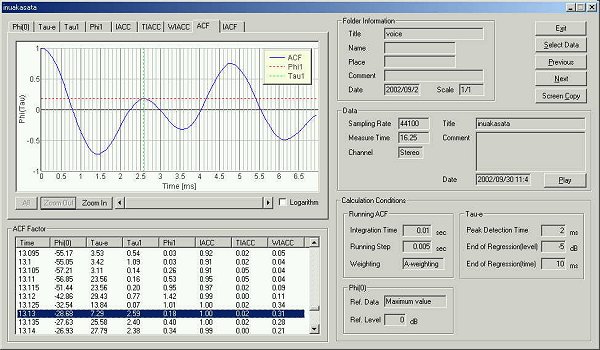
| "Ra"
13.13 second after measurement start, 20msec after utterance
start t1=2.59msec / f1=0.18 / te=7.29msec / ƒ³(0) (SPL)=-28.68dB |
| "Wa"
14.68 second after measurement start, 5msec after utterance start t1=0.25msec / f1=0.69 / te=7.42msec / ƒ³(0) (SPL)=-55.12dB |
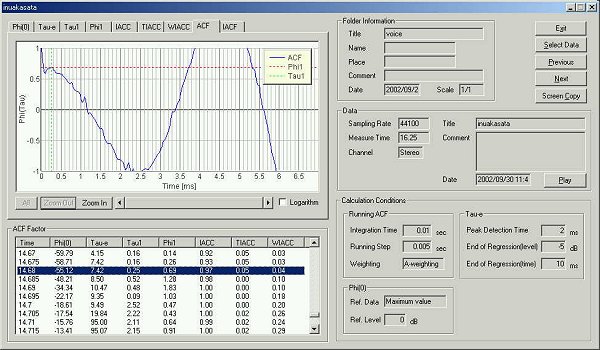
The figure was made by the screen copy function of SA. The ACF is measured
for the utterance of "wa".
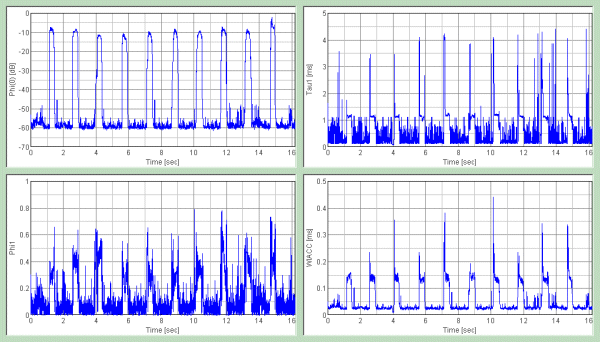
In the figure below, time change of four parameters (SPL, t1, f1, WIACC) are shown.
In the following table, the ACF parameters for ten syllables are summarized
with the previously measured data.
| time(ms) | utterance(ms) | t1(ms) | f1 | te(ms) | |
| a tune do | 0.625 | 35 | 1.13 | 0.27 | 6.80 |
| a tune re | 2.040 | 10 | 1.22 | 0.32 | 4.30 |
| a tune mi | 3.575 | 20 | 1.20 | 0.32 | 6.27 |
| a tune fa | 5.075 | 20 | 1.22 | 0.38 | 4.94 |
| a tune so | 6.605 | 25 | 1.20 | 0.66 | 7.76 |
| a tune ra | 8.140 | 5 | 1.18 | 0.49 | 6.45 |
| a tune si | 9.650 | 10 | 1.30 | 0.30 | 4.91 |
| a tune do | 11.255 | 20 | 1.25 | 0.50 | 4.45 |
| a vowel compare | 5 | 1.18 | 0.44 | 3.98 | |
| i | 10 | 0.27 | 0.97 | 6.78 | |
| u | 10 | 2.18 | 1.00 | 5.05 | |
| e | 15 | 0.29 | 0.50 | 15.48 | |
| o | 15 | 1.18 | 0.35 | 21.80 | |
| a | 25 | 1.20 | 0.45 | 8.46 | |
| Ka | 10 | 1.86 | 0.46 | 6.26 | |
| Sa | 60 | 0.09 | 0.64 | 2.48 | |
| Ta | 10 | 1.93 | 0.43 | 5.07 | |
| Na | 25 | 4.35 | 0.98 | 21.94 | |
| Ha | 40 | 0.70 | 0.16 | 3.22 | |
| Ma | 15 | 4.08 | 1.00 | 8.86 | |
| Ya | 15 | 0.11 | 1.00 | 10.09 | |
| Ra | 20 | 2.59 | 0.18 | 7.29 | |
| Wa | 5 | 0.25 | 0.69 | 7.42 |
September 2002 by Masatsugu Sakurai