| Japanese | English |
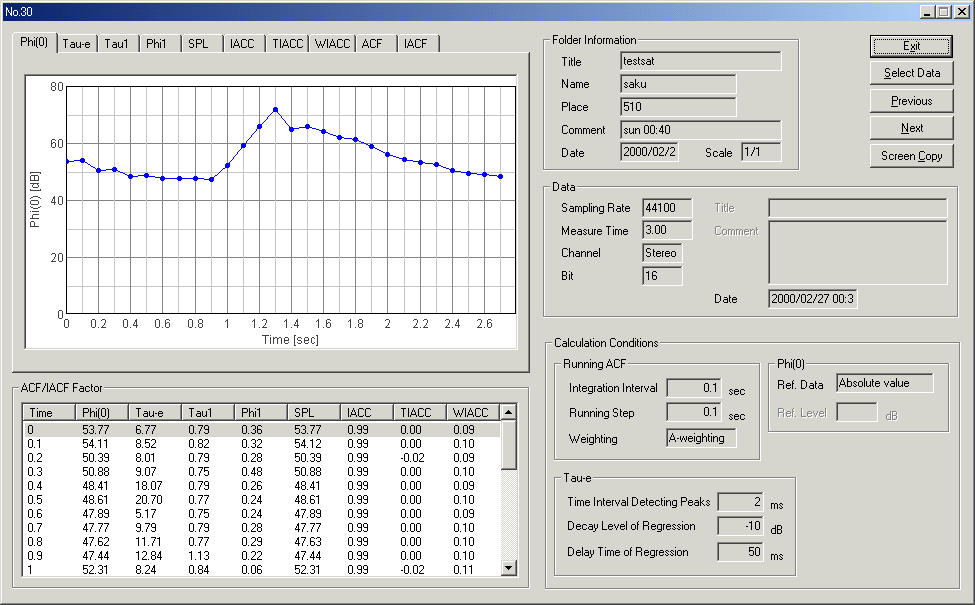
The following figure is the example of the analysis result display in SA (Sound Analyzer). Click the "Screen Copy" button to save data.
If MMLIB is started beforehand, the "MMLIB" button will become effective.
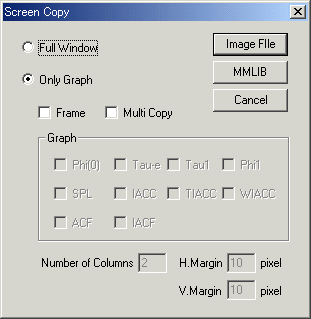
Click the "MMLIB" button.
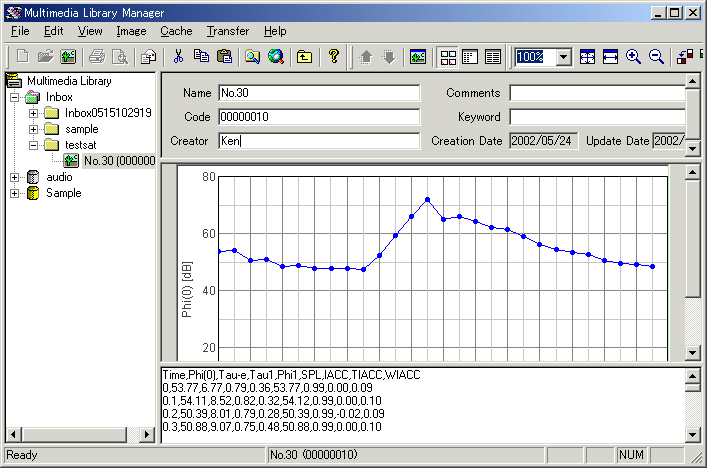
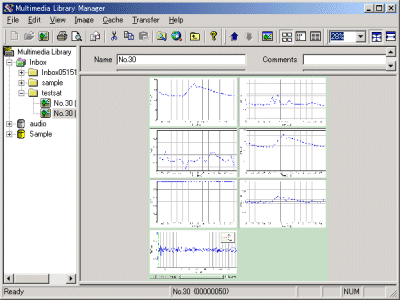
Data is added in the "Inbox" folder in MMLIB. Folder and data name is as it was in SA. You can see the graph in the main window, and the ACF factors analyzed (numerical values) are also registered as a text format.
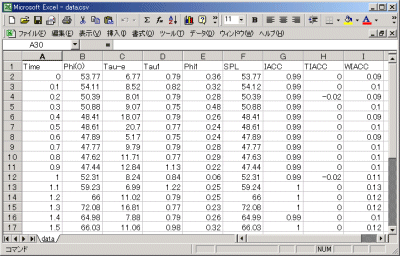
Text data is comma-delimited (See above screen). Save it to the CSV file, and then read this CSV file from the Excel. This operation enables to treat the data as the table form as follows.
Also, "Multi Copy" of nine kinds of graph is possible. It can register them as image data in a single file.
Please try DSSF3 combined with MMLIB. They will surely be useful for your research.