| Japanese | English |
In this series of the measurement report, I analyzed the engine sound recordings of a movie. The movie was dubbed to a digital video tape, and transferred to the PC via iLINK connection. The video camera I used is SONY DCR-PC3-NTSC, and the PC is SONY VAIO PCG-R505R/DK. Pictures in the following pages are taken from the screen. Captured sounds were saved as wav files, so that I can analyze them repeatedly.
In the previous report, the engine sound of Ferrari F40 during a start acceleration was analyzed. This time is the analysis of the engine sound of Ferrari F40 running on the mountain side.
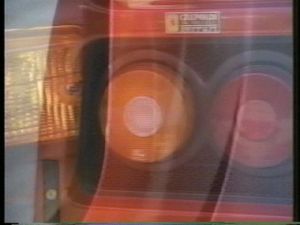
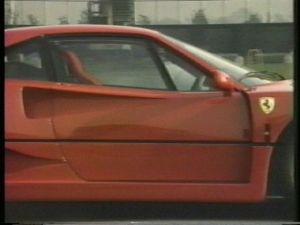
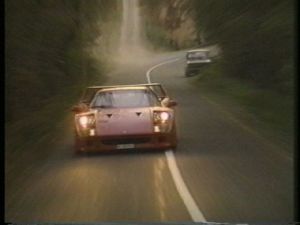 |
The car is approaching like this. |
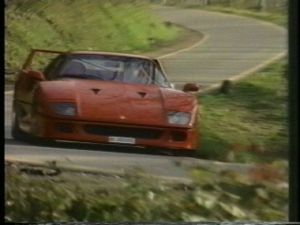 |
The sound file starts after this frame. It lasts for 8 seconds. |
![]() car1.wav (44.1kHz / Stereo / 10sec / 1,723KB)
car1.wav (44.1kHz / Stereo / 10sec / 1,723KB)
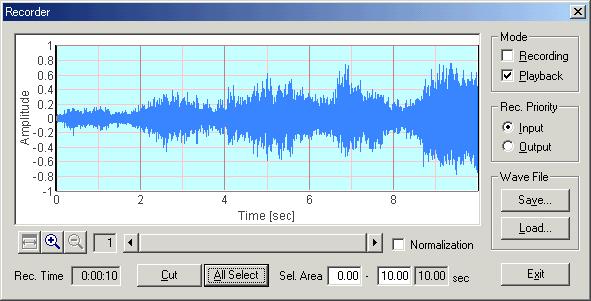
Same as last time, the wav file was loaded on the Recorder and analyzed by the FFT analyzer of the Realtime Analyzer of DSSF3.
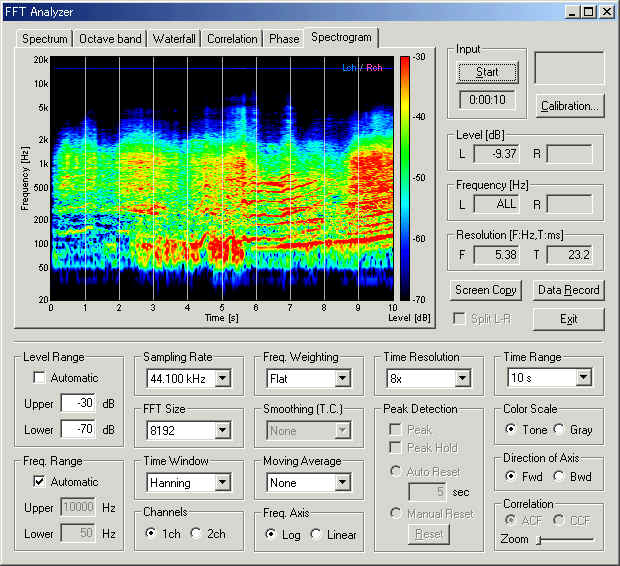
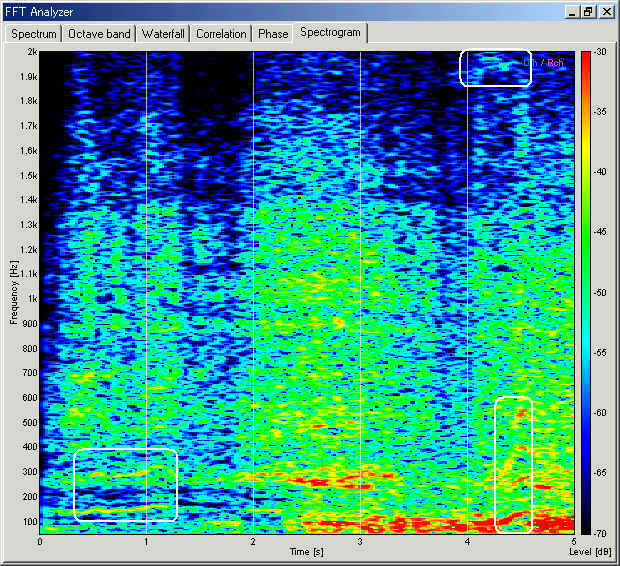
Below is the spectrogram view of the loaded sound for 10 seconds. Sound energy at a given time and frequency is displayed by the different color. Red area indicates the strong frequency component contained in the sound. The thin red lines represent the tonal (harmonic) sound, and the broad red area represents the noisy sound. At a first glance, the first part of the recording is dominated by the noisy sound, probably caused by the friction between tire and road. The engine sound dominates in the second part (around 6-8 s), and again masked by the noise (9-10 s).
Now, the first 5 s portion of the spectrogram is shown. "Freq.
range" was changed to 50-2000 Hz, "Time Range" was changed to 5
s, and "Freq. Axis" was changed to Linear. Other settings are same as
above. After the window was maximized by clicking the ![]() button, the measurement was started by Alt+S keys (keyboard shortcut). As was
seen in the above, this portion is dominated by the noisy sound. Tonal sound can
be seen only in 0.5-1.0 s at 150 Hz, and in 4.5 s at 100 Hz. In the later part,
the fundamental frequency rapidly increases from 100 Hz to 150 Hz, showing the
engine speed's increase. You may notice a slight high-pitched sound is heard at
4.0-4.5 s. This is indicated as a sky-blue area at about 2kHz in the
spectrogram. Is this sound caused by a wind turbulence?
button, the measurement was started by Alt+S keys (keyboard shortcut). As was
seen in the above, this portion is dominated by the noisy sound. Tonal sound can
be seen only in 0.5-1.0 s at 150 Hz, and in 4.5 s at 100 Hz. In the later part,
the fundamental frequency rapidly increases from 100 Hz to 150 Hz, showing the
engine speed's increase. You may notice a slight high-pitched sound is heard at
4.0-4.5 s. This is indicated as a sky-blue area at about 2kHz in the
spectrogram. Is this sound caused by a wind turbulence?
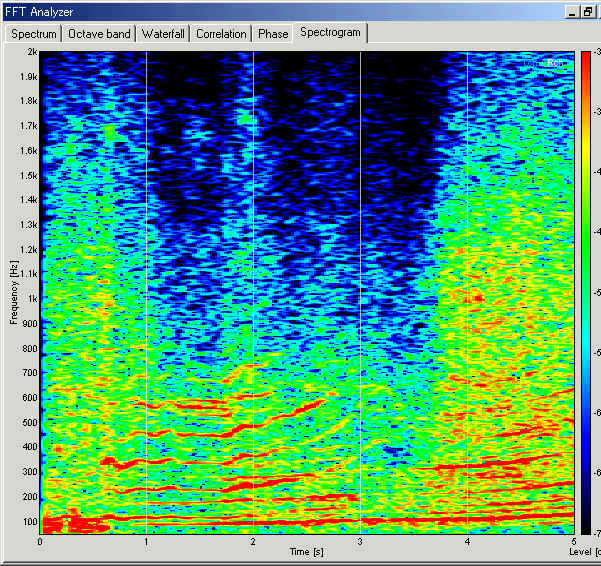
Similarly, the spectrogram of the second part (6-10 s) is shown. In this part, the strong tonal sound caused by the engine's vibration is dominant. The engine sound generally consists of the frequency components, called the fundamental frequency (F0) and the harmonics (integer multiples of F0) as shown in the previous report. But in this case, the relationship between the frequency components is more complex.
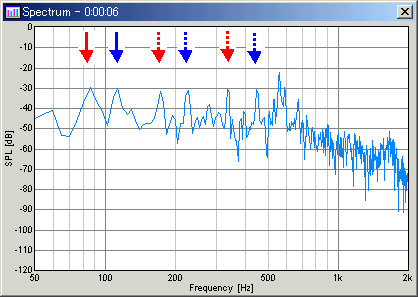
Let's see the spectrum at 1.5 s (at 6.5 s in the full recording). It seems that the sound consists two dominant vibrations at this moment. The red arrow in the leftmost indicates the lowest frequency (86 Hz). Dotted red arrows are its harmonics (172 Hz and 340 Hz). Similarly, the blue arrows indicate peaks at 112 Hz, 224 Hz, 450 Hz, which are harmonically related too. It is not clear what is the cause of these vibrations, but it seems the mixing of two vibrations makes sound rough and harsh.
February 2002 by Masatsugu Sakurai