| Japanese | English |
| Date: | 23:00, 30 Sep. 2002 |
| Place: | Nagoya, Japan |
| Microphone: | SONY ECM-MS957 |
| Microphone amplifier | SONY DAT WALKMAN TCD-D100 |
| Personal computer: | DELL INSPIRON 7500 |
| OS: | Windows 2000 Professional |
| Software: | DSSF3 |
| WAVE sound file: |
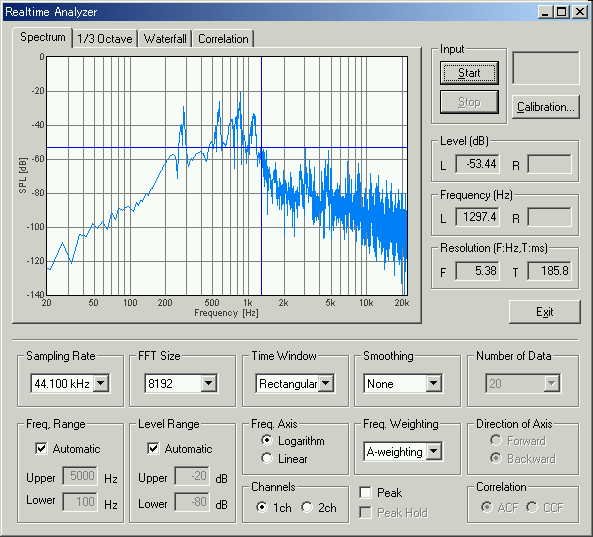
This is the power spectrum of "i".
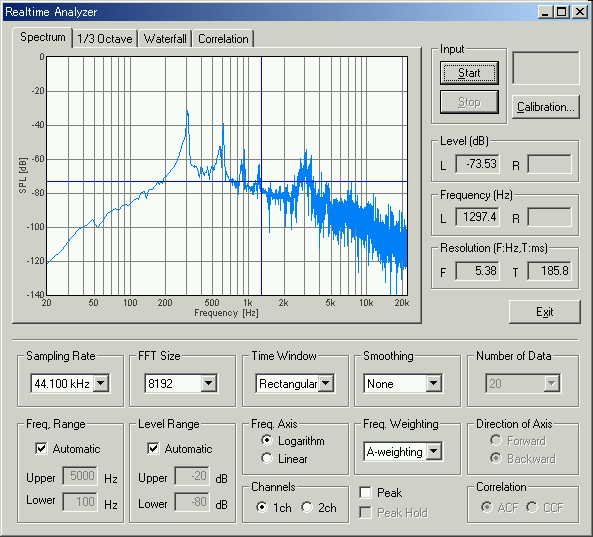
The peak frequencies are found at 300, 600, 900, 1200, 3000 Hz. The high frequency range of the spectrum roughly decreases 6dB/Oct. It is the general characteristic of the speech signal. The fundamental frequency is at 300 Hz and the first formant (F1) is at 600 Hz.
This is the power spectrum of "u".
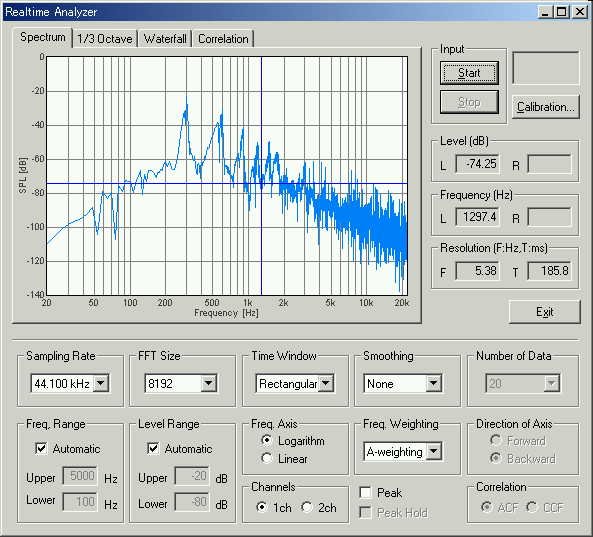
Same as "i", the fundamental frequency and the first formant (F1) is at 300 and 600 Hz.
The spectrum of "e".
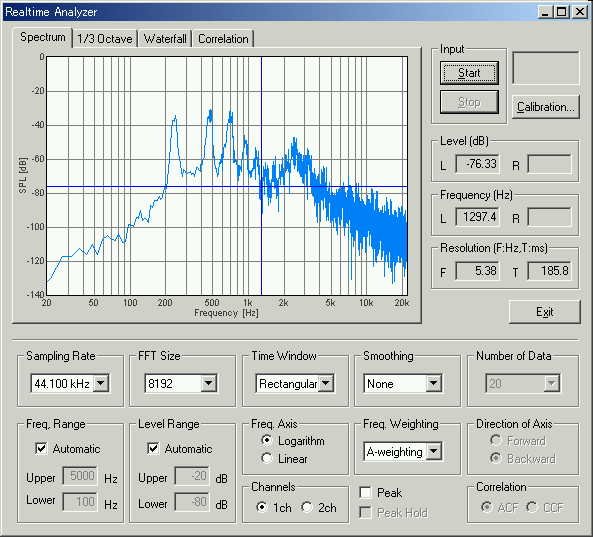
The fundamental and F1 frequency is seen at 240 and 720 Hz.
The spectrum of "o".
The fundamental and the F1 frequencies are at 280 and 840 Hz.
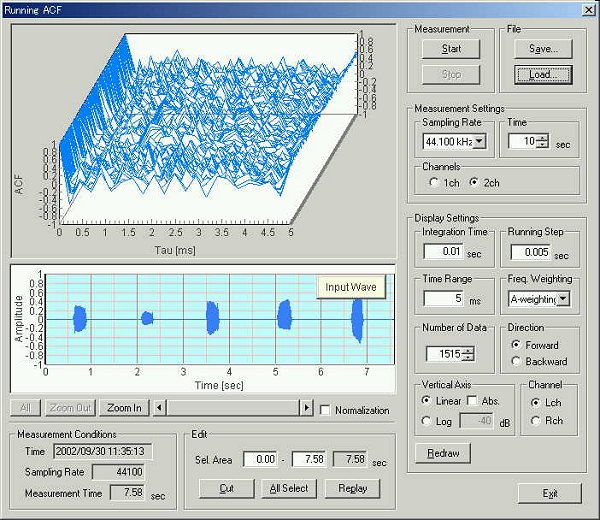
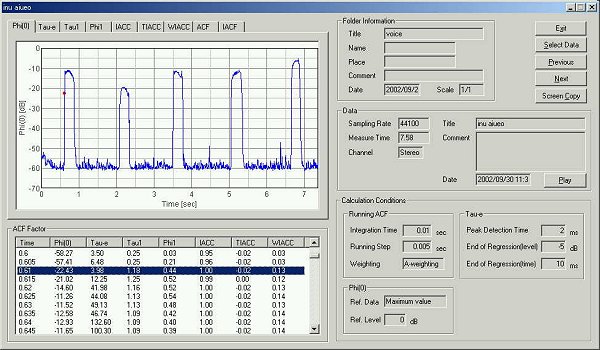
Next, the running ACF analysis is shown.
This is the time change of the sound level. Five utterances can be seen.
This is the ACF of "e" measured at the point when the te is minimum.
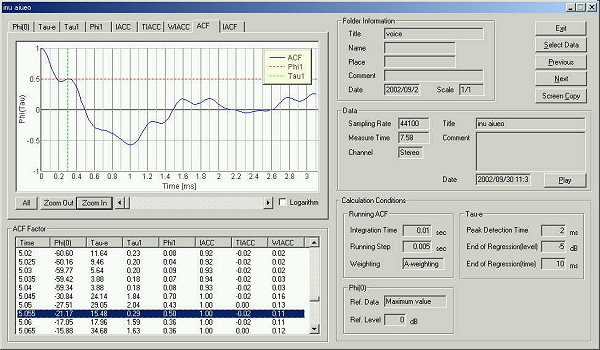
This point is 15 ms after the utterance began. It is the point that the change of the voice is the maximum.
The t1 value corresponds to the high frequency component above 3 kHz. It is the characteristic of "e".
This is the ACF of "o" measured at the point when the te
is minimum.
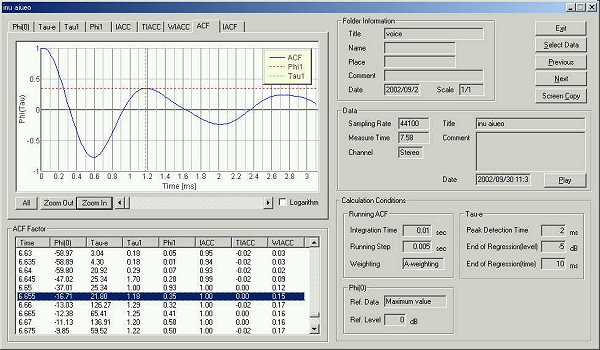
This point is 15 ms after the utterance began. It is the point that the change of the voice is the maximum.
The t1 value corresponds to the frequency component at 800 Hz. It is the characteristic of "o".
All of the analysis results are summarized.
The figure below shows all of the ACF and the IACF parameters. This figure
can be output by one click using the screen copy function of the DSSF3.
In the t1 graph, the difference between five vowels can be seen clearly.
| vowel | SPL | time (s) | utterance (ms) | t1(ms) |
f1 |
te (ms) | |
| a | start | -57.41 | 0.605 | 0 | 0.25 | 0.21 | 6.48 |
| -22.43 | 0.61 | 5 | 1.18 | 0.44 | 3.98 | ||
| -21.02 | 0.615 | 10 | 1.25 | 0.52 | 12.25 | ||
| -14.6 | 0.62 | 15 | 1.16 | 0.52 | 41.98 | ||
| max | -11.26 | 0.625 | 20 | 1.13 | 0.54 | 44.08 | |
| -11.52 | 0.63 | 25 | 1.13 | 0.48 | 49.13 | ||
| i | start | -59.03 | 2.075 | 0 | 0.14 | 0.06 | 9.88 |
| -45.37 | 2.08 | 5 | 0.32 | 0.65 | 9.88 | ||
| -30.26 | 2.085 | 10 | 0.27 | 0.97 | 6.78 | ||
| -25.26 | 2.09 | 15 | 2.13 | 0.35 | 17.19 | ||
| max | -23.75 | 2.095 | 20 | 1.79 | 0.11 | 26.88 | |
| -23.99 | 2.1 | 25 | 0.27 | 0.76 | 29.22 | ||
| u | start | -58.14 | 3.495 | 0 | 0.7 | 0.18 | 5.03 |
| -24.77 | 3.5 | 5 | 0.05 | 1 | 5.19 | ||
| -17.23 | 3.505 | 10 | 2.18 | 1 | 5.05 | ||
| -13.56 | 3.51 | 15 | 2.15 | 0.98 | 56.93 | ||
| -11.84 | 3.515 | 20 | 2.06 | 0.79 | 49.3 | ||
| max | -11.42 | 3.52 | 25 | 1.97 | 0.58 | 58.22 | |
| -11.9 | 3.525 | 30 | 1.86 | 0.38 | 35.99 | ||
| e | start | -59.34 | 5.04 | 0 | 0.18 | 0.08 | 3.88 |
| -30.84 | 5.045 | 5 | 1.84 | 0.7 | 24.14 | ||
| -27.51 | 5.05 | 10 | 2.04 | 0.43 | 29.05 | ||
| -21.17 | 5.055 | 15 | 0.29 | 0.5 | 15.48 | ||
| -17.05 | 5.06 | 20 | 1.59 | 0.36 | 17.98 | ||
| -15.88 | 5.065 | 25 | 1.63 | 0.36 | 34.68 | ||
| -15.45 | 5.07 | 30 | 1.61 | 0.34 | 22.88 | ||
| max | -14.66 | 5.075 | 35 | 1.59 | 0.33 | 24.45 | |
| -14.75 | 5.08 | 40 | 1.56 | 0.34 | 53.48 | ||
| o | start | -59.8 | 6.64 | 0 | 0.29 | 0.07 | 20.92 |
| -47.02 | 6.645 | 5 | 1.7 | 0.28 | 25.34 | ||
| -37.01 | 6.65 | 10 | 1 | 0.93 | 25.34 | ||
| -16.71 | 6.655 | 15 | 1.18 | 0.35 | 21.8 | ||
| -13.03 | 6.66 | 20 | 1.29 | 0.32 | 126.27 | ||
| -13.28 | 6.665 | 25 | 1.25 | 0.41 | 65.41 | ||
| -11.13 | 6.67 | 30 | 1.2 | 0.58 | 136.91 | ||
| max | -9.85 | 6.675 | 35 | 1.22 | 0.5 | 59.52 | |
| -10.03 | 6.68 | 40 | 1.2 | 0.49 | 44.89 |
In the present ACF analysis, the measured parameters are the time delay and the
amplitude of the first peak. In the table above, the ACF parameters t1,
f1, and te
measured in every 5 ms for each vowel are summarized. To identify what
sound is uttered or who is talking, it is necessary to compare those parameters
for various conditions. As the first step, the ACF was measured for different
vowels uttered by the same speaker.
For comparison, the ACF parameters measured in the last experiment is
summarized below.
| time (s) | utterance (ms) | t1(ms) | f1 | te (ms) | |
| a tune do | 0.625 | 35 | 1.13 | 0.27 | 6.8 |
| a tune re | 2.04 | 10 | 1.22 | 0.32 | 4.3 |
| a tune mi | 3.575 | 20 | 1.2 | 0.32 | 6.27 |
| a tune fa | 5.075 | 20 | 1.22 | 0.38 | 4.94 |
| a tune so | 6.605 | 25 | 1.2 | 0.66 | 7.76 |
| a tune ra | 8.14 | 5 | 1.18 | 0.49 | 6.45 |
| a tune si | 9.65 | 10 | 1.3 | 0.3 | 4.91 |
| a tune do high | 11.255 | 20 | 1.25 | 0.5 | 4.45 |
| a vowel compare | 5 | 1.18 | 0.44 | 3.98 | |
| i | 10 | 0.27 | 0.97 | 6.78 | |
| u | 10 | 2.18 | 1 | 5.05 | |
| e | 15 | 0.29 | 0.5 | 15.48 | |
| o | 15 | 1.18 | 0.35 | 21.8 |
April 2003 by Masatsugu Sakurai