| Japanese | English |
This time, analysis result of the impulse response measured at point 5 will be presented as in the last report.
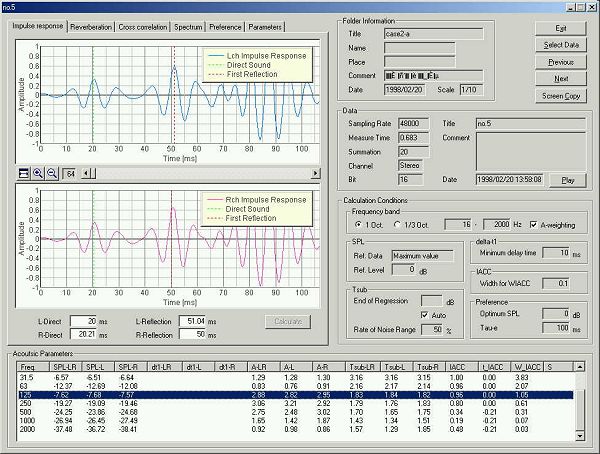
This is the impulse response for 125 Hz band.
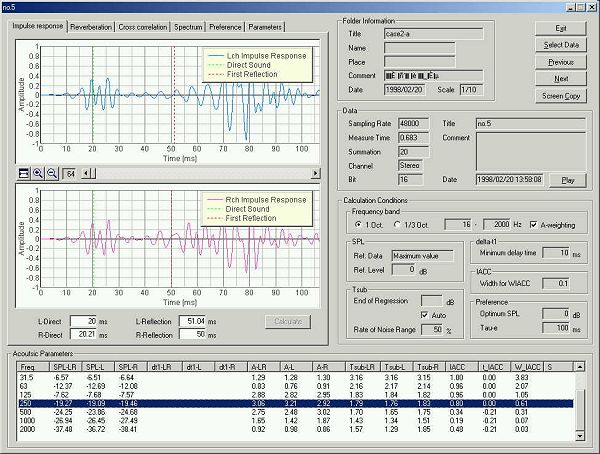
This is the impulse response for 250 Hz band.
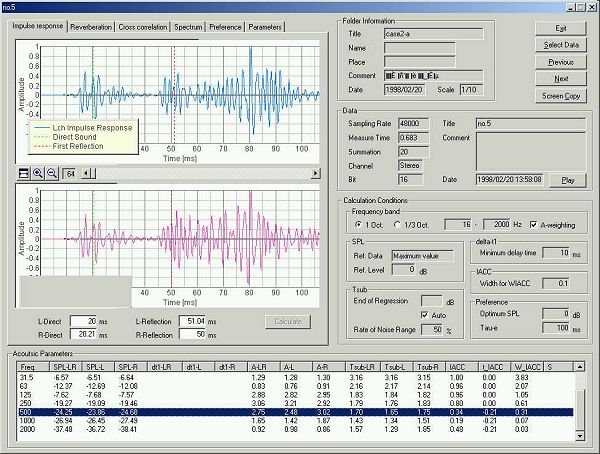
This is the impulse response for 500 Hz band.
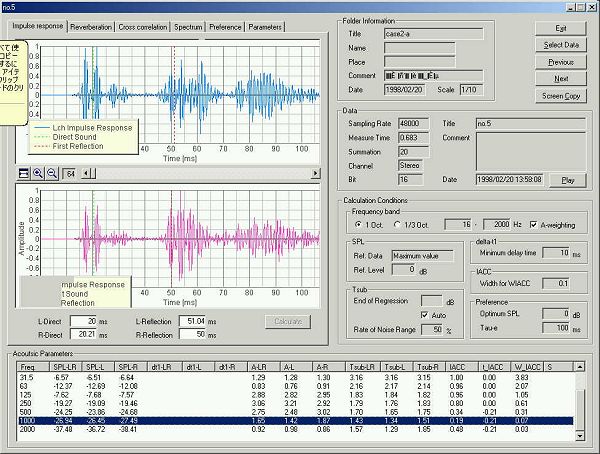
This is for 1 kHz.
In SA, the direct sound and the first reflective sound are detected as the maximum amplitude of the impulse response waveform. Direct sound and reflective sound are not clear in the band-passed waveforms. So, the arrival time of direct and initial reflection are detected from the all-pass band impulse response. In this measurement, time difference between the direct and the reflection (i.e. initial time delay gap, dt1 as shown in the table below the graph) is about 30 ms.
This is a reverberation analysis for 500 Hz band. Reverberation time is calculated from the Schroeder integration curve.
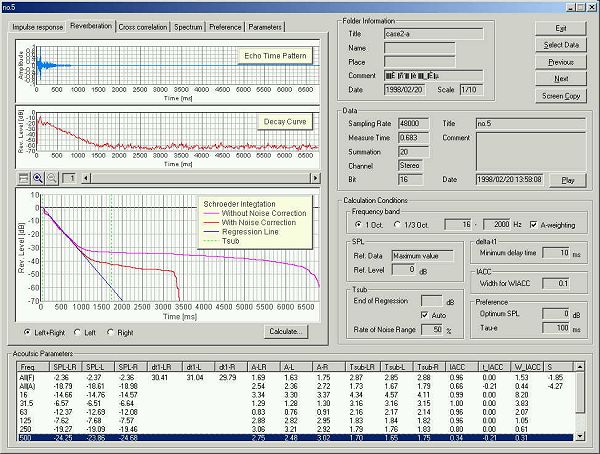
Echo time pattern (impulse response), energy decay curve (squared impulse response), and Schroeder Integration curve (backward integrated squared impulse response) are displayed. Red curve in the Schroeder integration is calculated with noise correction. Blue line is a linear regression line of the reverberation curve. Reverberation time (Tsub) is calculated from this regression line. In this case, reverberation time is 1.7 s. When you set the "End of Regression" as "Auto", regression line is calculated for the reverberation curve between zero dB and 5 dB above the average noise level.
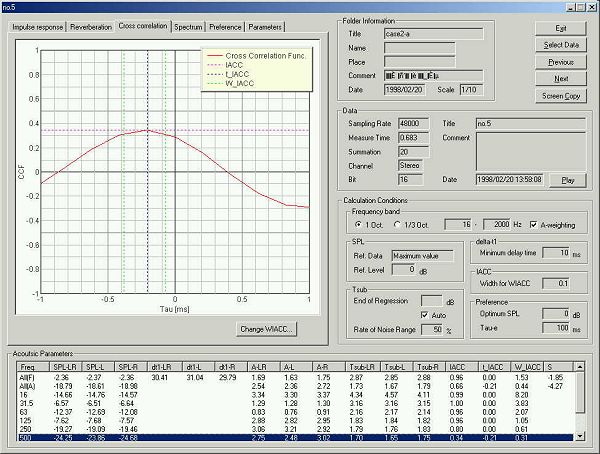
Cross correlation function for 500 Hz band. Tau axis shows the inter-aural time difference (called ITD or tIACC). This value corresponds to the angle of incidence of sound. Positive value means the sound comes from right, and negative value means sound comes from left. The peak amplitude is IACC. In this case, t_IACC is -0.21 and IACC is 0.34.
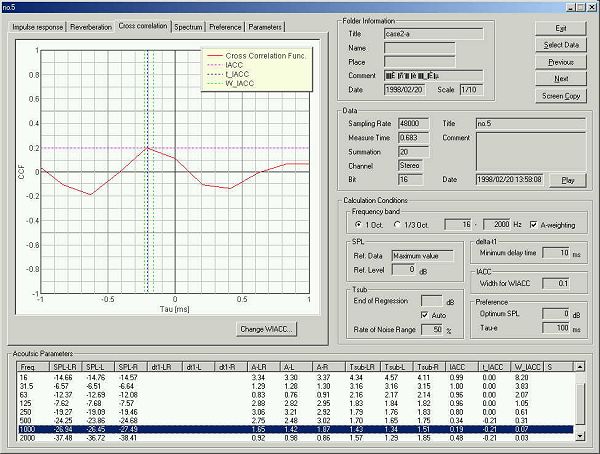
In 1000Hz, IACC=0.19 and tIACC=-0.21.
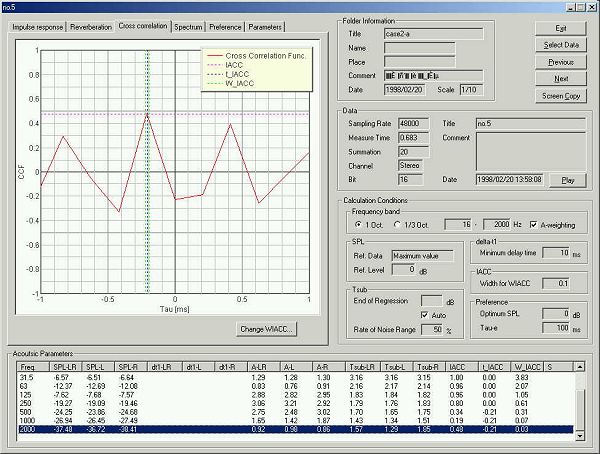
In 2000Hz, IACC=0.48, and tIACC=-0.21.
When the peak of the cross-correlation function is shifted to left or right from zero, apparent sound source position also shifts. If the actual position and apparent position are largely separated, it is called "Image shift" and is one of the acoustical problem. To eliminate such a problem, angle of the reflector panels are carefully adjusted.
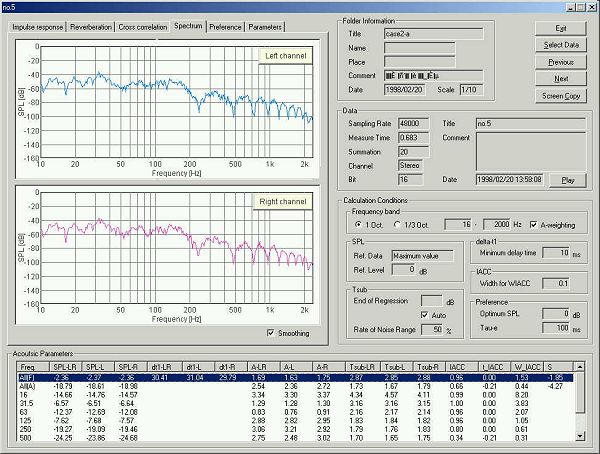
This is a power spectrum of the impulse response. It is also called as the transfer function of the room.
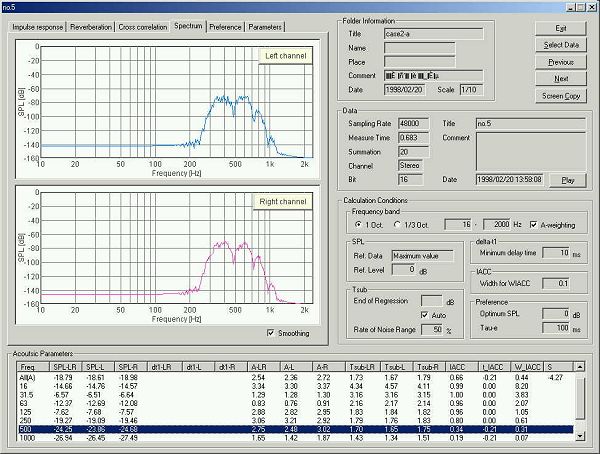
This is a spectrum for 500 Hz band.
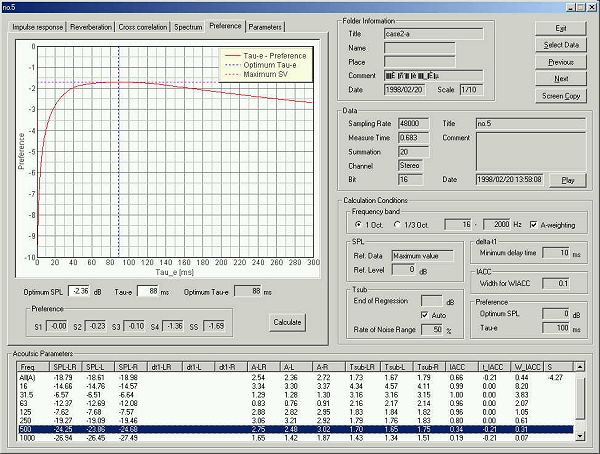
This is a preference curve. Preferred te value of music is above 40 ms. This hall is suited for music with long te value. See "Audio measurement report 3" for more information about te value and preference.
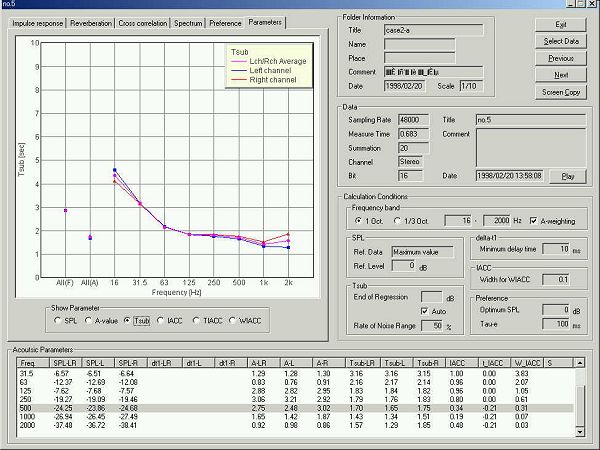
This is a display of the SPL as a function of center frequency. Frequency characteristics of the important acoustical parameters are displayed in a graph like this.
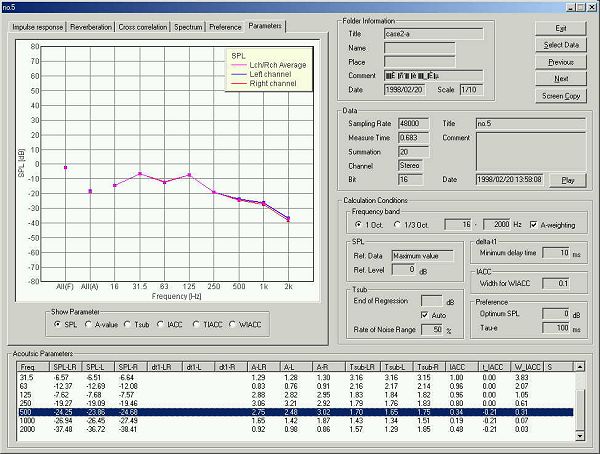
Reverberation time
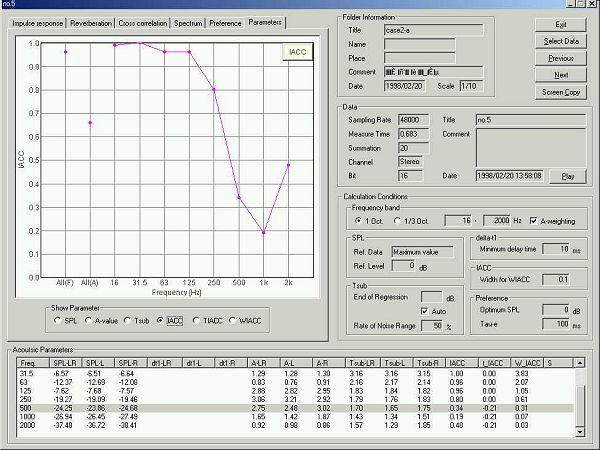
IACC. Basically, IACC becomes large in the low frequencies, because the similar sound arrives at both ears. It is said that the subjective impression of spaciousness is mainly decided by the IACC in the center frequencies of 500, 1k, and 2kHz.
June 2003 by Masatsugu Sakurai