| Japanese | English |
When a sound is emitted in the room, it will first reach to a listener directly (it is called a direct sound). While the sound wave is traveling, its pressure level decreases according to the inverse square law. Much sound reaches to the listener, after reflecting on the walls. In the meantime, the sound is attenuated on a certain frequency more than other frequency for change like diffusion, absorption, reflection, and refraction. Hearing such a sound differs greatly from hearing sound at once. (by Don Davis, Sound system engineering.)
This time, I report the acoustics measurement performed in an auditorium in Kobe, Japan.
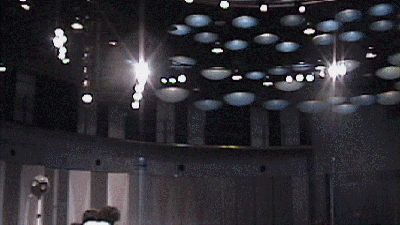 |
Diffusers on the ceiling: Orbis hall, Kobe, Japan. |
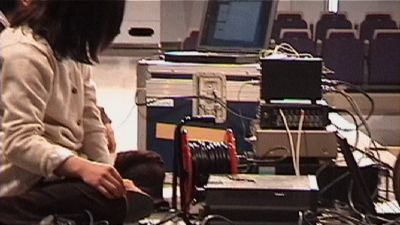 |
Measurement equipments. |
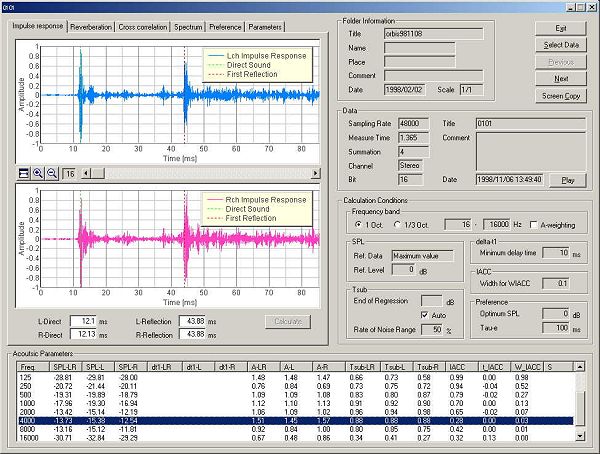
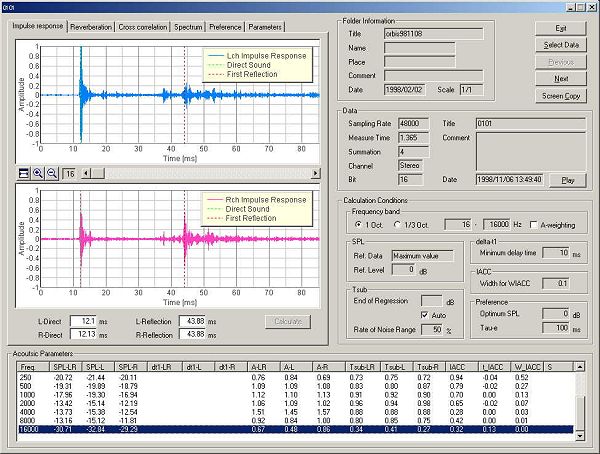
The figure below shows an example of the impulse response measured in the Orbis hall in Kobe. Comparing this with the listening room, the arrival time of the direct sound and the reflective sound is very long. In this case, the direct sound and the reflective sound is clearly distinguishable. To pick up the strong initial reflection automatically, the "Minimum delay time" was set to 10 ms in the calculation condition setting. The purpose of this parameter setting is to ignore the floor reflection.
Sound file :![]() audio3.wav (48kHz / Stereo / 1.365s / 256KB)
audio3.wav (48kHz / Stereo / 1.365s / 256KB)
This is the impulse response for 4 kHz band. The IACC of 0.28 is a very good value for the spaciousness. If the IACC increases, good spaciousness or the sense of envelopment could not be attained. In the listening room, the IACC value was almost 1.
This is the impulse response for 16 kHz. In this case, it is measured with a good S/N ratio, because the quality of the loudspeaker is good. As shown in Audio measurement 2, KENWOOD OMNI 5 has the sufficient quality between 500 and 4000 Hz.
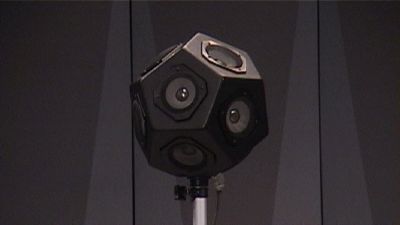
This is the omni directional loudspeaker used for the measurement.
The acoustical characteristics of the room are analyzed by the sound analyzer (SA). The optimal value (target value) of the sound parameter is explained first. Take it just as reference since this is the case of a large room like a concert hall.
SPL (Sound pressure level)
The optimal sound pressure level is 77-79dBA for slow tempo music and is 79-80dBA for the quick tempo music. The most important conclusion is that the optimal level does not shift from 79dBA greatly even if a music motif and tempo is different. (Yoichi Ando, Concert hall acoustics)
Dt1 (Initial time delay gap)
The optimal value of dt1 depends on the amplitude of the reflective sound, and Tau_e value of the music to be performed. This Tau_e value is the effective duration of the autocorrelation function of the music signal. It is calculated from the running ACF measurement. Refer to the following table for a general value of typical music.
Usually, dt1 becomes somewhat shorter than Tau_e. If it is longer than Tau_e, echo disturbance (separation of direct sound and reflective sound) happens. If short on the contrary, a feeling of spaciousness decreases since direct sound and reflective sound will come simultaneously. Also, direct sound and reflective sound interfere and it is colored by sound (coloration).
Reverberation time
| Range of Tau_e | Optimal RT | |
| Speech | 10 - 40 ms | 0.23~0.92 sec |
| Vocal music | 20 - 60 ms | 0.46~1.38 sec |
| Orchestra | 30 - 80 ms | 0.69~1.84 sec |
| Pipe organ | 0 - 170 ms | 2.3~3.91 sec |
As shown in the table, the optimal reverberation time is about 23 times of Tau_e. The above is a summary from Ando's Concert hall acoustics.
The reverberation time is the time required to decrease 60dB, after the sound of a stationary state stops.
In SA, Tsub (Subsequent reverberation time) is calculated by Schroeder integration. The reverberation time is calculated using the straight regression of a period (10dB attenuation time) from the beginning. Automatic logic is used for these calculation.
The calculation conditions for the impulse response
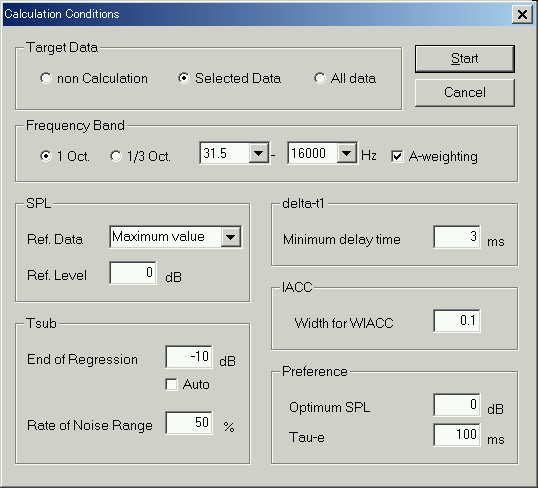
The parameters were calculated by SA.
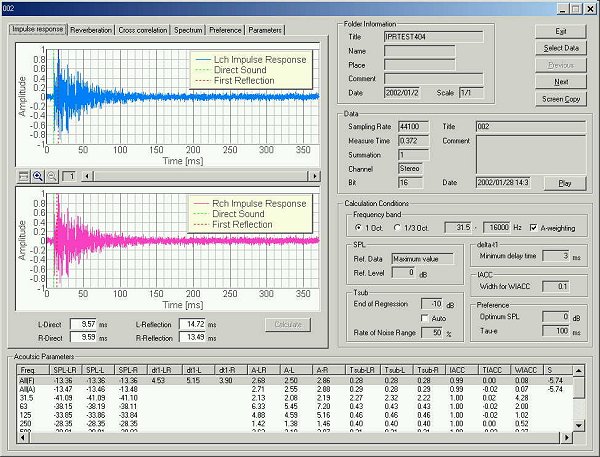
Automatic calculation of the reverberation time of 1 octave band frequency and 1/3 octave band frequency is possible. Here, the results of the 1 octave analysis is shown. Analysis for all frequency with the A-weighting filter. The A-weighting filter is an approximation of the ear sensitivity.
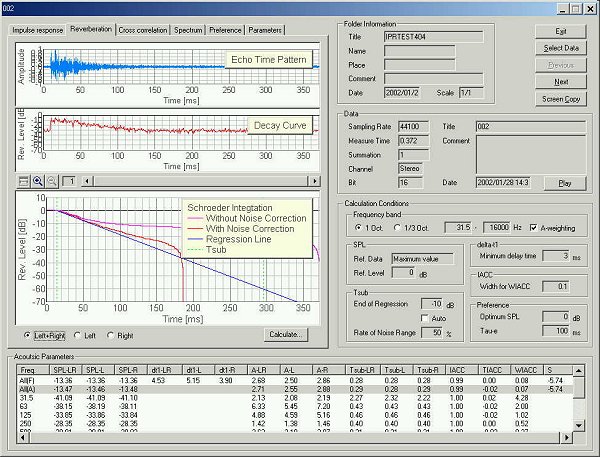
A green line in the left side of the graph shows the time delay of the initial reflection (14 ms). Red and pink curves show the Schroeder integration with and without noise correction. In the noise correction setting, signal in the latter 50 % time range is not used for the calculation. This noise-corrected curve is used for the calculation of the reverberation time. The straight regression line is calculated between 0 dB and 10 dB (see the setting window above) points. The reverberation time is the point at which the straight line decreases to 60 dB. In this graph, this point is found at 295 ms.
Calculated values for each octave band are shown in the table below the graphs. This is the reverberation analysis for the 500 Hz band.
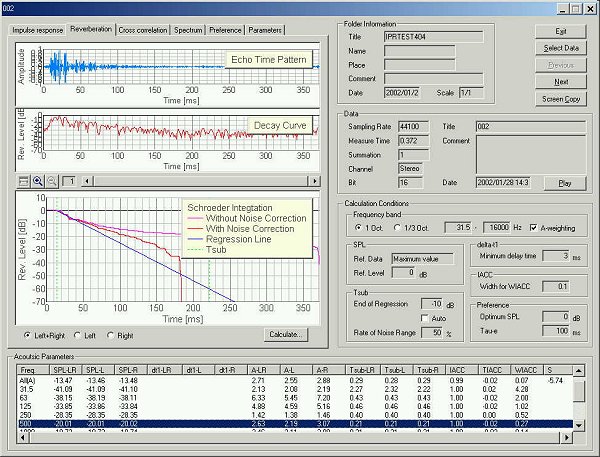
In the usual room acoustics measurement, the reverberation time for 500 Hz is
used. In this measurement, the reverberation time was 0.21 s. The recommended
values of the reverberation time for the listening room are shown below.
| 22.5 m2 | 50 m2 | 80 m2 | ||
| Listening room | 0.5 | 0.51 | 0.6 | (Beranek) |
| Audition room | 0.3 | 0.32 | 0.37 | (Beranek) |
| AV theater | 0.14 - 0.25 | 0.15 - 0.26 | 0.16 - 0.28 | (Lucas) |
May 2003 by Masatsugu Sakurai