When the electric sound engineer tries to get more acoustic gain and the
improvement of the sound quality, he can LOOK the result of adjustment not only
hear the sound. If it took 20 minutes for one frequency curve, now you will get
it just in 20 msec. You can work more efficiently. It is one of the most useful
audio measurement equipment!
Broad examples of measurement with DSSF3, RAE, RAD are introduced on Introduction
to Simple Sound Measurement, such as a measurement in a concert hall,
measurement of a home audio and car audio, tuning of a musical instrument,
aircraft noise measurement, traffic noise measurement, analysis of toilet noise,
musical instrument music analysis, voice analysis, performance measurement of a
motor, measurement of the operation sound of an air-conditioner, and heartbeat
measurement.
Waterfall (RAL/RAD/RAE)
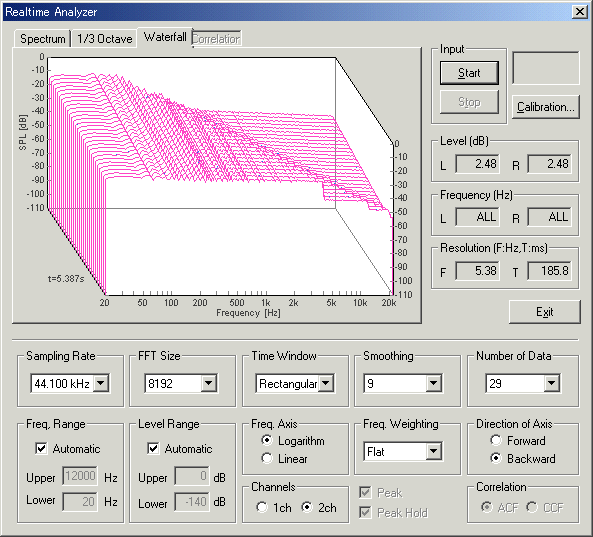
3D display (time, energy, and frequency)
Allows display of composite domains with priority on time resolution or
frequency resolution in stereo 2 channels as desired. The 3D display is most
effective for investigating transient responses of equipment, and reveals the
largest area compared to the operation of an equalizer. This permits
steady-state and transient-state responses to be observed at the same time.
While various types of signals can be used, a sweep sine wave signal is used for
analysis, such as to analyze the response characteristics of a speaker.
Oscilloscope (RAL/RAD/RAE)
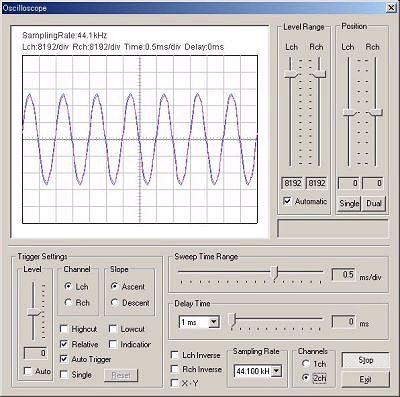
Even if it is looked like a correct measurement apparently, the recorded signal may be surprisingly distorted by overload. It is because of the quality of an amplifier inside a PC or a wrong setting of the dynamic range of AD/DA converter. Using an oscilloscope and a signal generator, such a distortion can be checked by test signals such as sine wave. After this simple check, a software volume of a mixer or a volume of AD/DA converter can be adjusted. The accuracy of a signal is the most important for the measurement. A "screen copy" can be used for recording a measurement data. It can record data more easily than photographs.
1/3 Octave (RAL/RAD/RAE)
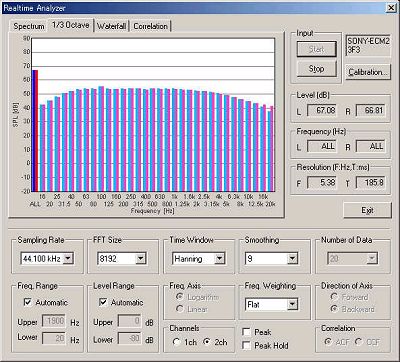
Above figure shows the frequency response of DELL Inspiron7500 notebook PC. If pink noise by the signal generator is input here, you can know features of the built-in amplifier.
Screen (Desktop)
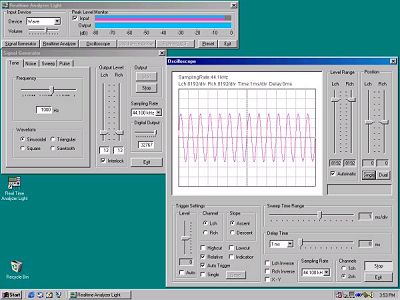
Peak level meter, Signal generator, and Oscilloscope operate simultaneously.
Analysis of speaker frequency response characteristic (RAL/RAD/RAE)
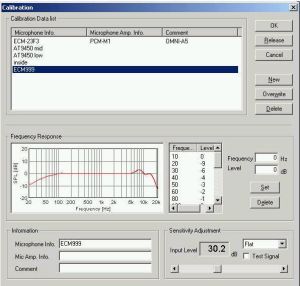 |
Calibration setting window for a frequency characteristics of speaker. |
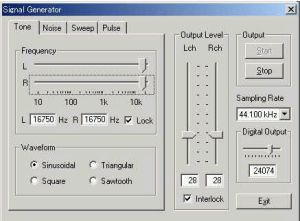 |
Singal generator window. |
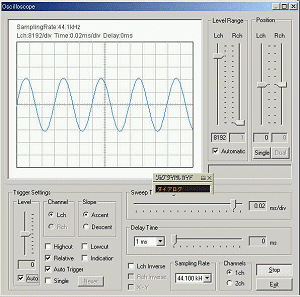 |
This is the monitor of the waveform in the exit of a mixer of VAIO. A test signal is inputted into LINE2 of Accuphase C290 preamplifier via a mixer, an analog amplifier and a headphone output terminal. Then, WATT speaker connected with A50 power amplifier is sounded.B |
Impulse response measurement (RAD/RAE)
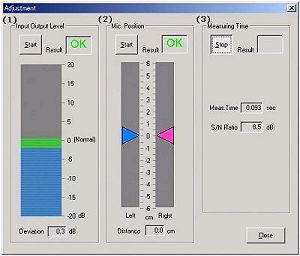 |
It should be confirmed whether "level adjustment" of input and output has been performed well first. It should be confirmed whether "level adjustment" of input and output has been performed well first. When O.K. does not come out here, any problem exists in your system. |
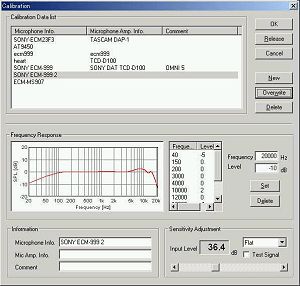 |
Using a personal computer as a measuring instrument, compensation of a microphone is required. RAD has sensitivity compensation function of a microphone or microphone amplifier, and the compensation function of the frequency characteristic of them. Many compensation data of a microphone can be saved and can be called easily. Once you compensate microphones, it will become the same thing as you have got the expensive "precise 2ch noise meter with 1/3 octave analyzer." |
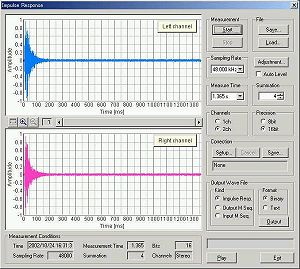 |
Also, this system can measure using simple and low-cost equipments. |
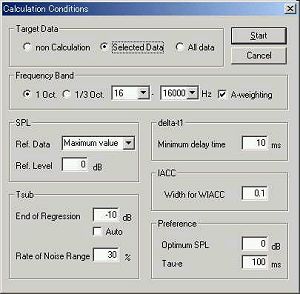 |
Calculation condition setup. |
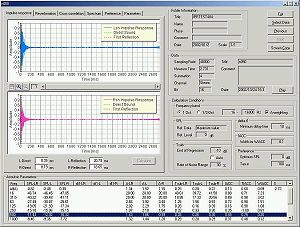 |
Analysis result by SA. |
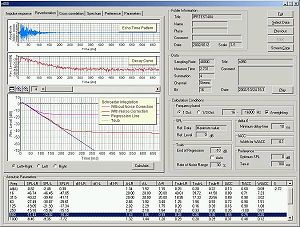 |
Analysis of the reverberation time. |
Running ACF analysis (RAD/RAE)
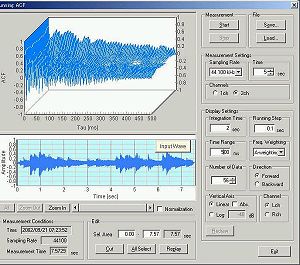 |
Sound motif in Sound Preference Audition Room is analysis by the running ACF. |
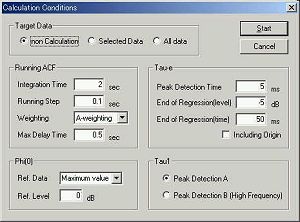 |
Calculation condition setup. |
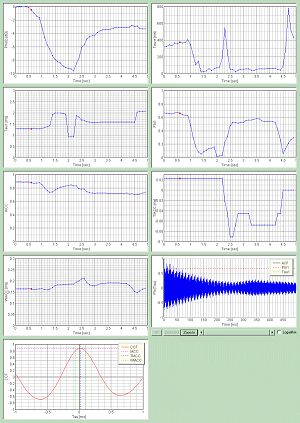 |
Analysis result of the running ACF. |
Environmental noise analysis (RAD/RAE)
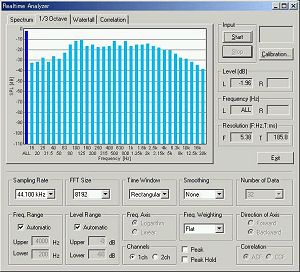 |
In AIRPORT NOISE ANALYSIS TESTING, 1/3 octave analysis by RA is shown. Generally, jet noise contains all frequency components. Especially, sound level is almost flat from 1 kHz to 6 kHz. |
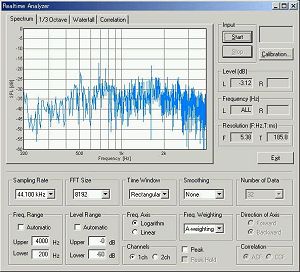 |
This is the power spectrum of the jet noise. Vertical axis and horizontal axis are specified by hand to see the fine structure around 2 kHz. Jet noise are look like a white noise, but also has a strong peak around 2 kHz.
|
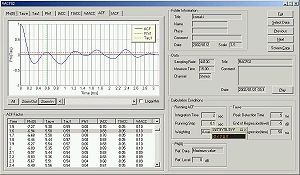 |
This is example of the ACF waveform. The ACF has; periodical peaks corresponding to the perceived pitch. |
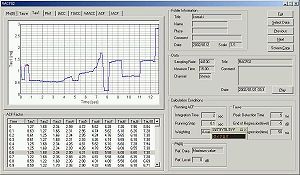 |
This is the time change of the fundamental frequency (pitch). ; It shows a dynamic change of pitch like a human speech. |