| Japanese | English |
After the system check, measurement was performed with the same system configuration. Sampling rate was 48000 Hz and measurement time was 0.683 s. Those values correspond to 4800 Hz and 6.83 s in the real world. To improve the S/N ratio of the measurement, synchronized summation was set to 20 times.
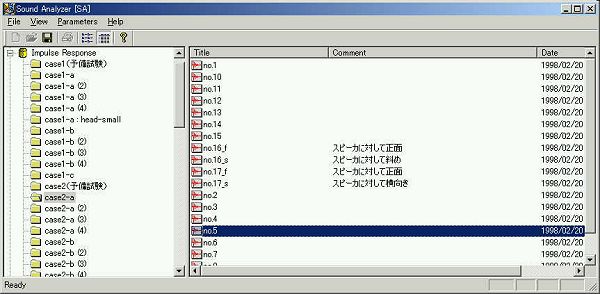
There are many measurement conditions in a concert hall, such as location of sound source and receiver. To reduce time and effort of the measurement, measurement conditions, date, and system settings are automatically recorded with the measurement data.
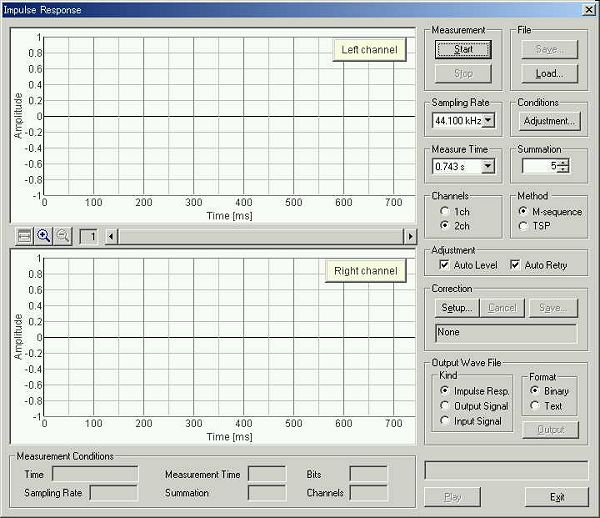
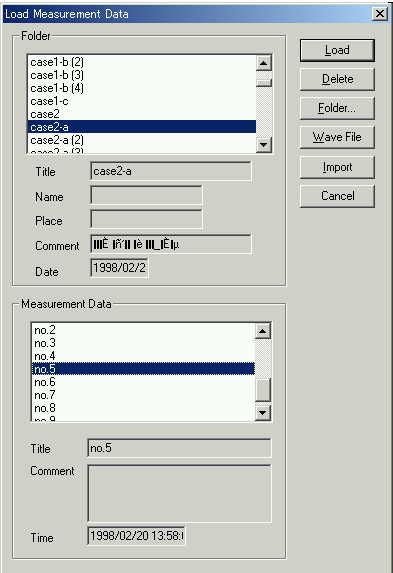
Now let's see the data for point 5. This is a initial window of the impulse response measurement. Previously measured data can be loaded on this window and can be analyzed again.
The data "case2-a, no.5" is loaded.
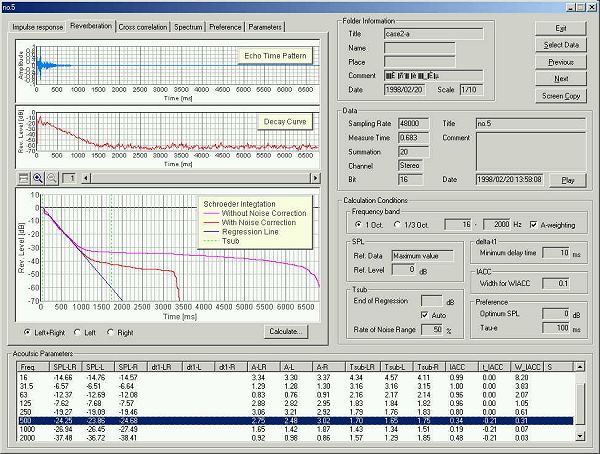
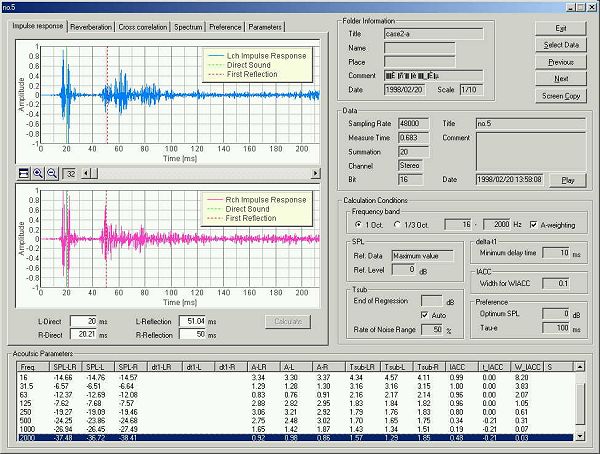
This is the impulse response measured at point 5. Measurement conditions display in the bottom of the window shows that this measurement was performed on 1998/2/20 13:58, with the sampling rate of 48000 Hz, measurement time of 0.683 s, 20 times summation, 16 bit, and stereo input.
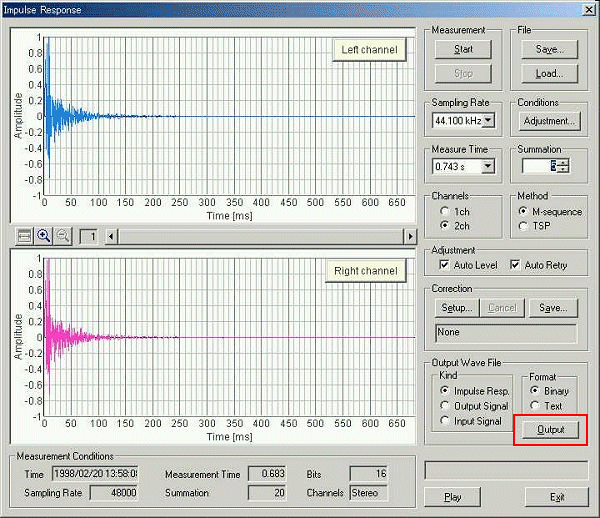
Specify the "Impulse Resp." and click the Output button to save the impulse response as a .wav format.
Sound file: ![]() hall2.wav (128KB)
hall2.wav (128KB)
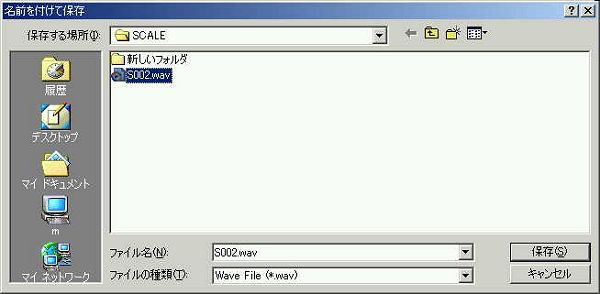
Download the sound file. You can listen to the impulse response. In the Realtime Analyzer, wav file can be loaded directly. Save the loaded data for further analysis. Click the "Save" button on the RA's impulse response window, then create a new folder to store data. Make sure that the scale is 1/10 for this sound file. Otherwise, the calculation will be wrong.
Below is the main window of the Sound Analyzer. Data saved in the Realtime Analyzer is displayed in this window. Now the data is analyzed.
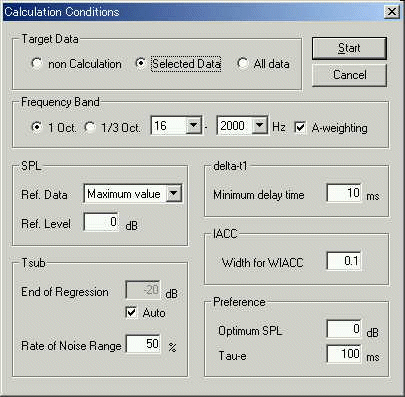
This is a calculation conditions dialog. Because this is a 1/10 scale model measurement, the highest frequency that can be measured with the sampling rate of 48000 Hz is 2400 Hz. For a full scale measurement, the important frequency band is between 125 Hz and 8000 Hz. In this example, frequency band between 16 and 2000 Hz is selected (Perhaps 16 Hz is not required actually. 125 Hz would be sufficient as a lower end.).
This is the analysis result window of SA. Try to listen to the sound by clicking the Play button. If the scale is changed to 1/10 when saving data, time scale of the sound is automatically expanded to x10. See the Folder Information on the top of the window.
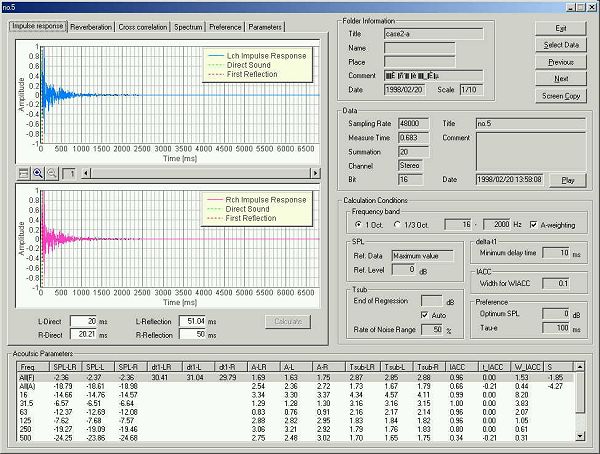
This is the impulse response waveform in 500 Hz band. The direct sound and the initial reflective sound are indicated by the dotted lines. This can be adjusted manually by moving the cursor.

This is the reverberation analysis for 500 Hz band. Reverberation time is 1.7 s.
This is the impulse response for 2000 Hz band.
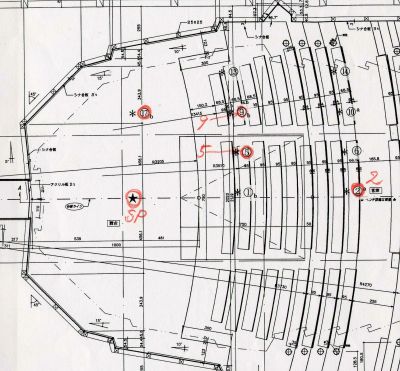
In the plan view below, the IACC (Inter-Aural Cross Correlation) values are shown. IACC is one of the most
important parameter in the concert hall acoustics, that corresponds to the
perceived spaciousness. When the IACC is low, rich spatial feeling is obtained. This is a result for a condition with columns and without diffuser panels.
Around the stage area IACC becomes high value (0.48), because the direct sound
component is too strong. See Appendix
of the Sound Analyzer's program manual for more information.
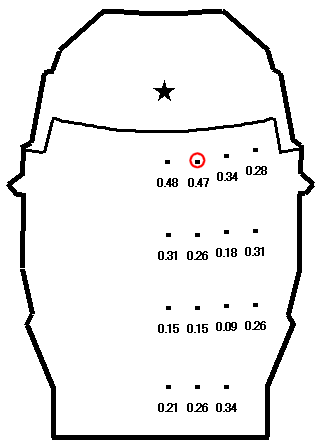
Generally, IACC becomes high around the stage area, because the direct sound is too strong. However, in the Tsuyama Hall, IACC has been improved by installing the reflector panels on the ceiling of the stage. These reflector panels increase the diffused reflections to the audience area close to the stage.
June 2003 by Masatsugu Sakurai