| Japanese | English |
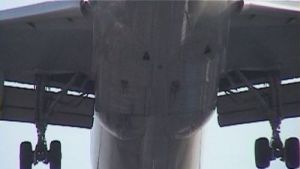
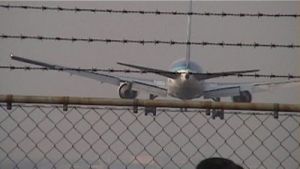
The ocean wave sound rolling in to the seashore is a comfortable sound. In contrast, sound of a train, bus, car, and air conditioner become a noise for us. Both sound have a low frequency component.
Neither speech nor music are interrupted by low frequency sound. The most sensitive frequency around 1.5-5kHz is used for communication. Frequency around 20-20kHz is used for music. However, super-low frequency sound is a component still lower than that. There is a comfortable sound, but other sound has a certain influence with mental disorder. The effect and the mechanism of the low frequency noise are not fully understood.
 |
 |
![]() air8.wav (44.1kHz / Stereo / 15sec / 2.52MB)
air8.wav (44.1kHz / Stereo / 15sec / 2.52MB)
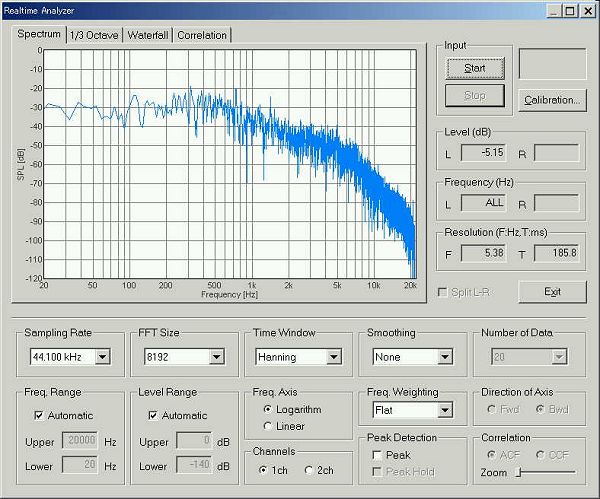
For comparison, the power spectrum is shown.
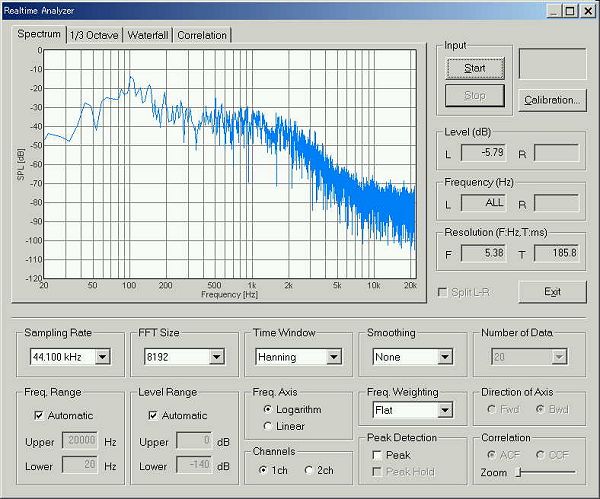
This is the power spectrum around 3.6 s. There are strong peaks around 1.5
kHz, 740 Hz, 300 Hz, 230 Hz, and 110 Hz. Low frequency components around 20 Hz
is increased about 20 dB from the graph above.
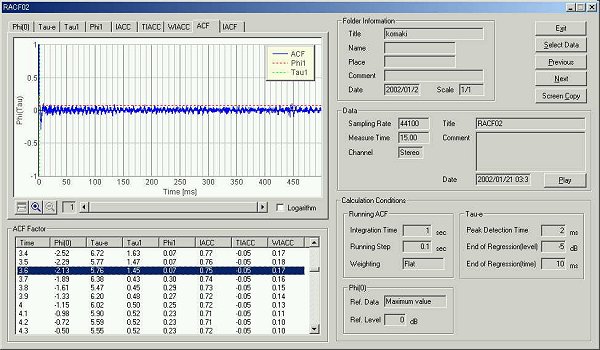
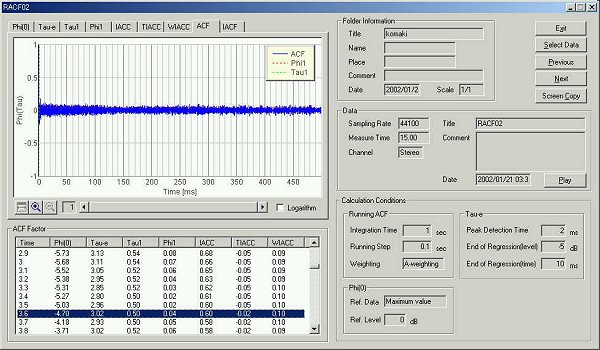
This is the ACF measured at 3.6 s. It looks like a white noise. The noise
level was 97 dB.
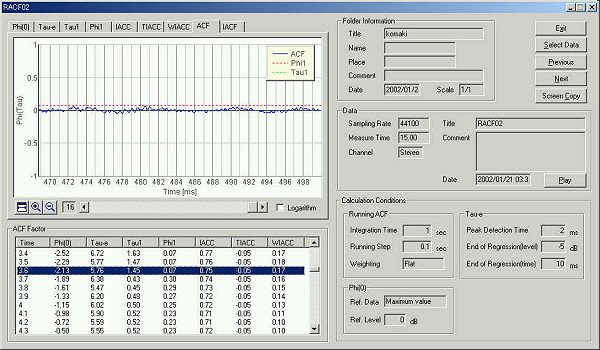
It is zoomed up to 8x. The graph is notched.

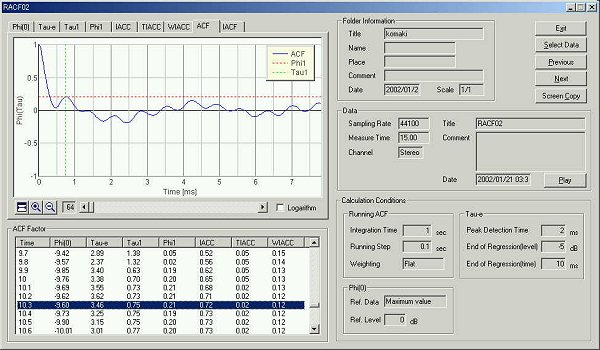
It was zoomed up to 16x. A sawtooth-like waveform is seen.
The waveform of the auto-correlation function is the composition of 1.5kHz
and 230Hz, which are measured by the spectrum. Although it can be theoretically
convinced, it is a strange waveform. Probably, super-low frequency below 20Hz is
also compounded. The autocorrelation does not decrease between 0.5 and 1.0 s.
This graph shows a time change of the pitch.
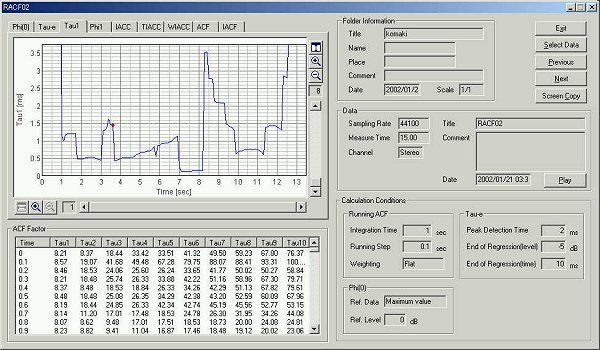
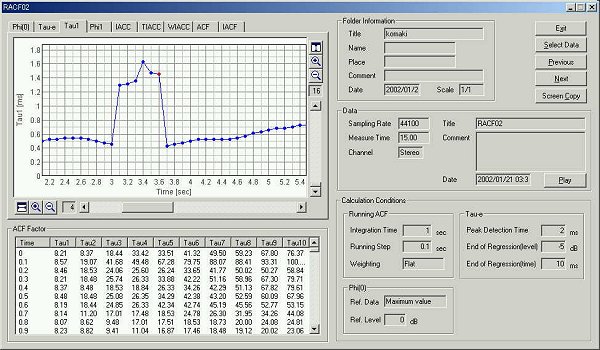
The graph of t1 is expanded. The marked point (3.6
s) is a time that contains much low frequency components. It seems to be the
moment of loosening the engine throttle.
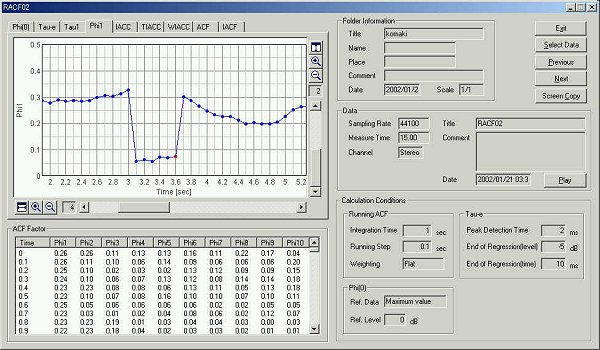
This is a graph of f1. It shows the pitch strength
of sound.
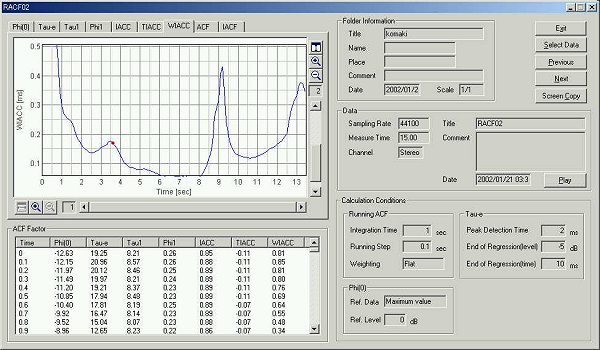
This is a graph of WIACC. It represents the width of a sound source. When the
low frequency is contained, the WIACC becomes a large value.
The ACF is measured with the A-weighting filter. The figure below is the ACF
at 3.6 sec. It can be seen that the pitch of a high frequency component is
emphasized. Because our ear is sensitive to this frequency range, the A-weighted
ACF is suited for noise analysis.
November 2002 by Masatsugu Sakurai