Chapter 2 Computational System of Simulating the Sound Field in a Room
2.1. Introduction
This paper describes a procedure for the acoustic design of a concert hall
that applies the theory of subjective preference, which is associated with the human cerebral hemispheres.
Four orthogonal physical factors can be calculated using architectural drawings.
2.2. Outline of Simulating the Sound Field in a Room
The testing room is divided into a sound field simulation
room (Figure 2.1) and a control room (Figure
2.2), which are partitioned by a double soundproof door. The interior of the
room is decorated and illuminated so that the user (the subject who is being
tested) does not feel locked inside a special room, surprised at being in a
soundless state that is not ordinarily experienced. In the control room, whose
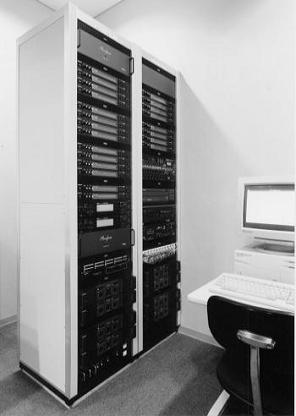
functions are described below, three workstations and a sound field synthesizer (Figure
2.3) are installed on a free-access floor. The test listening method is a
multi-speaker method that allows up to four people to listen simultaneously. The
speakers are arranged to emphasize the precise reproduction of the direction of
reflected sound. The entire surface of the speakers is covered with glass wool
to a thickness of 50 mm, minimizing the reflection of medium- and high-frequency
sound.
Figure 2.1. The souond simulation room of the Miyama Conceru. Reproduced
with kind permission of Mr Suiyo Sato, Suikoh-sya, Tokyo, Japan.
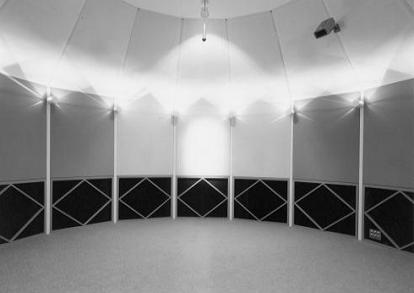
Figure 2.2. The control room for sound simulation etc. Reproduced
with kind permission of Mr Suiyo Sato, Suikoh-sya, Tokyo, Japan.
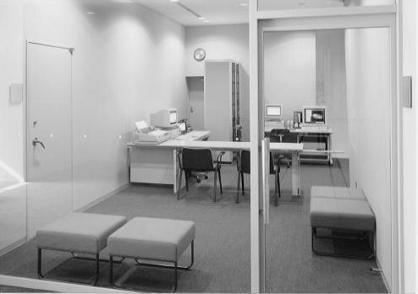
Figure 2.3. The hardware for the souond simulation. Reproduced with kind
permission of Mr Suiyo Sato, Suikoh-sya, Tokyo, Japan.
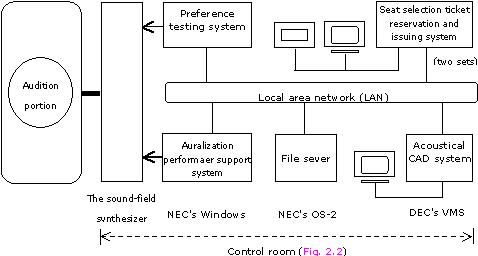
Composition of the overall software system
The system shown in Figure
2.4 is a computer system based on the client-server model and operate under
three different operating systems, namely, DEC VMS, NEC OS-2, and Windows. The
acoustical CAD system supports everything from the input of architectural
drawings to the acoustical design of the interior of the room by the sound ray
tracing method and mirror image method, as well as its visual presentation. The
part of the routine of the effective wall is shown in Appendix
A. A file server allows the sound field auralization system [47,
48] to use the results of the acoustical CAD system. The auralization system
also feeds the results to the devices for sound field synthesis and
equalization. The seat reservation and ticket issuing system, as an independent
subsystem on the LAN, has the functions of event control, testing for sound
preferences, issuance of individual cards, seat selection, ticket reservation,
and ticket issuance. These functions can run simultaneously from multiple (at
present, two) workstations on the LAN.
Figure 2.4. Composition of the overall software and hardware system.
2.3. An Application in Designing of the Kirishima International Concert Hall
The physical factors at each seat were calculated at the
design stage with architectural drawings using the image method [31].
In the computer mode, the effect of diffusers on the walls at high frequencies,
reflections and scattering caused by seats were not taken into account in the
calculation. A single source was considered, located at 3m from the stage front,
2m to the side of the centre line, and 1.5 m above the stage Boor. The direct
sound and reflections up to third order, which included about 300 reflections,
with their amplitudes, delay times, and directions of arrival at the listeners
were calculated. In the calculation of IACC, white noise was selected as the
source signal. In this calculation, the reverberation time is assumed to be 1.8
s (500Hz, occupied) throughout the hall.
The calculated results for the physical factors of the
listening level, the initial time delay gap, the IACC, and the total amplitude
of reflections (A-Value) are shown in Figure
2.5. The value for the listening level has a range of ±4.0 dB through b out
the main audience moor. The largest initial time delay Dt1
(27 ms) is observed near the source on the center line of the hall. The IACC at
each seat is less than 0.2, except for seats close to the source.
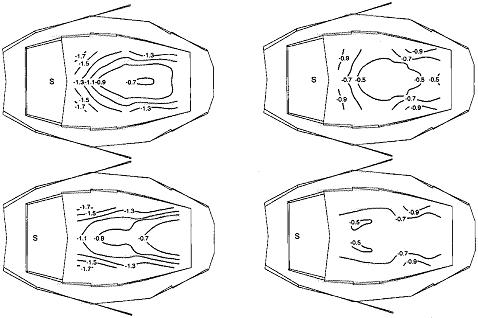
Scale values of subjective preference for listeners are shown
in Figure 2.6. For slow tempo music
(Music motif A), positioning the source near to the stage front increases the
total scale value in seats near the back wall of main audience moor. For fast
tempo music (Music motif B), positioning the source near the back wall of the
stage increases the total scale value in seats at the center of the main
audience floor. As far as the type of music is concerned, the fast tempo music
may be best suited for this hall. Preference for performers is not discussed
here, but it has been obtained for changes in the delay time of a single
reflection [32].
Figure 2.5. Results of calculated values of physical factors: (a) Contour
lines of equal relative listening level [dB]; (b) Contour lines of initial time
delay gap between the direct sound and first reflection excluding the floor
reflection [ms] ; (c) Contour lines of equal IACC for white noise; (d) Contour
lines of equal A-value.
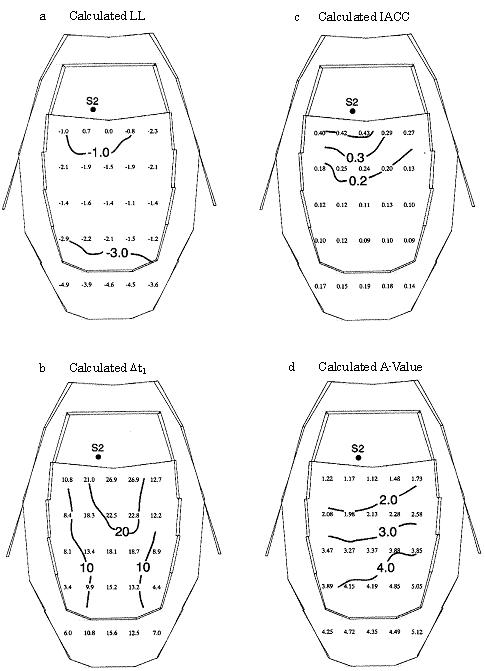
Figure 2.6. Results of calculated scale values of subjective preference
for two source positions: (a) Music motif A; (b) Music Motif B.
2.4. Remarks
Based on previous study, sound fields ware simulated by the
concert hall building plan in the designing stage. After obtaining the binaural
impulse responses at each seat, four orthogonal factors including the sound
pressure level (SPL), the initial time delay gap between the direct sound and
the first reflection (Dt1), the subsequent
reverberation time (Tsub) and the interaural crosscorrelation (IACC)
ware analyzed to evaluate subjective preference. The sound fields at each seat
in the concert hall can be evaluated before construction.
| BACK
| NEXT |