Recently, one of the users of DSSF3 kindly provided his voice recording and analysis results. He is a chiropractic lecturer and is investigating how to care for the throat muscles to maintain a good condition of vocal chords, and what kind of treatment and training are effective for improving the singing voice. His current interest is to evaluate the effect of his training on the quality of voice, especially on the expansion of the vocal range and the increase of the vocal strength. The following report might be of interest to both of singers and trainers.
A female amateur singer's voice was recorded three times: before warm up, after stretching exercise of throat muscles, and after some warm up singing. In all recording sessions, she sang vowel /a/ in eight pitches from C4 (260 Hz) to C5 (520 Hz). Reference tones were presented by a piano just before producing each voice.
In the following, we will see the spectrograms of sung voices. How to analyze the wav files can be found in another page: Spectrogram. You can try the same measurement by downloading the sound files. In the following figures, time axis (horizontal axis) of the spectrogram was adjusted to match the duration of the recordings. Frequency axis (vertical axis) was set to Logarithmic, with its range from 100 Hz to 20000 Hz. Results of each recording session consist of two screen shots of the spectrograms that includes four voices. In total eight pitches ranges from C4 to C5.
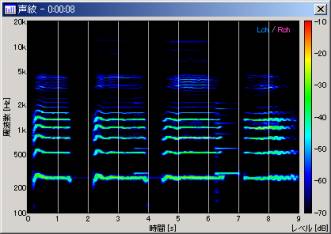
In the spectrogram, strong energy components are indicated by bright colors. The lowest frequency band corresponds to the pitch of the voice (it is called the Fundamental frequency: F0). You can see that F0s shift upward as the pitch increases. Next, the high energy components can be seen at the multiples of F0 (2*F0, 3*F0, 4*F0...). These components are called the Harmonics. The human voice consists of the fundamental frequency and its harmonics.
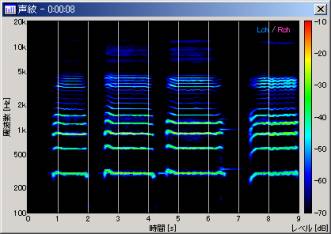
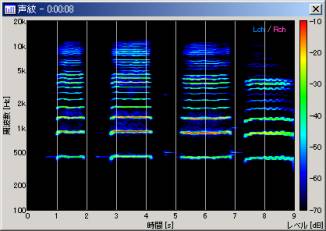
Before warm up (sound file: 0316_001.wav)
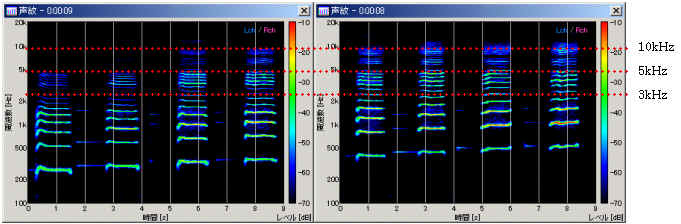
Pay attention to the area indicated by the red dotted lines, 3kHz-5kHz and 5kHz-10kHz. You can see that the bands of energy in these area become clear as the pitch increases (from left to right in the above figure). It means that the energy in these frequency range is getting stronger. Strong energy at around 3 kHz is called the singing formant or singer's formant, and is a characteristic of the singing voice that is not seen in the speaking voice (explanation can be seen here).
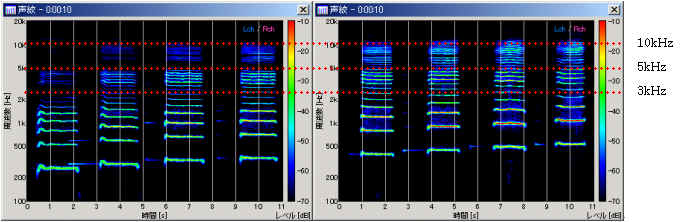
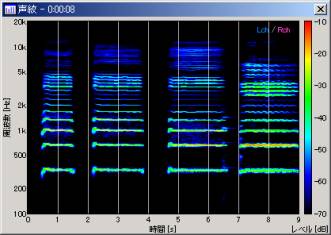
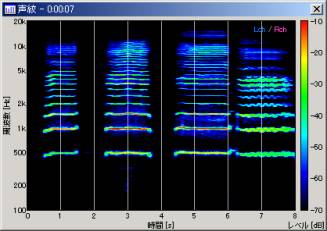
After stretching exercise of throat muscles (sound file: 0316_002.wav)
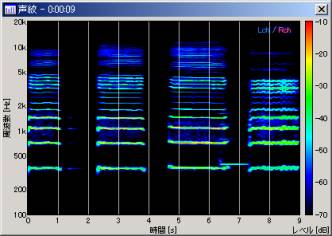
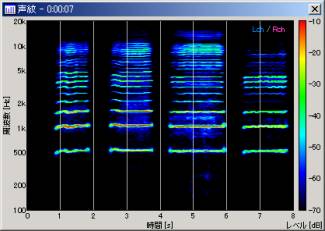
After warm up singing (sound file: 0316_003.wav)
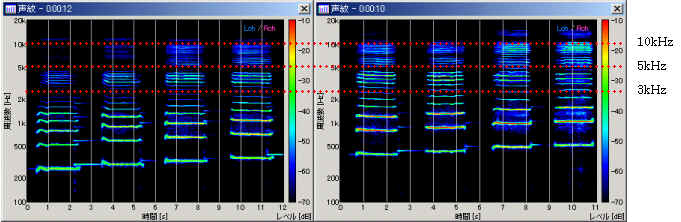
Comparing the spectrograms of before and after warm up, we can see that the singing formant becomes dominant after warm up. It seems that the utterance method changed from the speaking voice to the singing voice by the stretching exercise and warm up. This tendency is remarkable in the low pitched voice. It may be possible that we can make a criterion to show the effect of a vocal training and warm up, by quantifying the difference of the energies in this region.
Next, we edited the sound files to make it easy to compare the difference before and after the training.
Note that Adobe
Audition was used for editing the sound files. Because the editing function
of DSSF3 is limited, it would be convenient to have another waveform editing
software like Audition.
In addition to the three recording sessions (before, after stretching, after warm up), the voice of a professional singers (tenor for E4, 330 Hz, and soprano for others) recorded in a commercial CD was analyzed as a reference. In all spectrograms below, the last one is the professional voice. It can be seen that the frequency components are vibrating, because of the strong vibrato. Singing formant is clearly visible in all pitches.
| C4, 260Hz (sound file: a1.wav) | D4, 290Hz (sound file: a2.wav) |
 |
 |
| E4, 330Hz (sound file: a3.wav) | F4, 350Hz (sound file: a4.wav) |
 |
 |
| G4, 390Hz (sound file: a5.wav) | A4, 440Hz (sound file: a6.wav) |
 |
 |
| B4, 490Hz (sound file: a7.wav) | A5, 520Hz (sound file: a8.wav) |
 |
 |
In the amateur voice, the singing formant becomes strong after warm up in the lower pitches (C4 and D4), though it is weaker than the professional voice. But as the pitch increases, the energy in the singing formant range does not seem to change before and after warm up. Remarkable change is the increase of energies in the much higher frequency range around 5-10 kHz. In contrast, the professional voice does not show such a strong energy in this range. By listening to the sound, you may notice that the voice is shrill when this high frequency energy is dominant. It sounds like she is screaming or shouting, rather than singing. On the other hand, the professional singer's voice sounds like she is singing very easily and comfortably.
This time, we found that the spectral energy in the region of the singing formant increases after warm up exercise.
But at the same time, we found the unwanted energy increase at the higher frequency. It was good that we found the difference in the perceptual impression appears clearly in the acoustic analysis.
Probably we should continue the investigation to confirm the findings in many subjects and to see whether we can use these results in the evaluation of our vocal training.
Singing voice is a musical instrument. Everyone can sing, but it is difficult to sing well without vocal training. Also, even for the trained singers, fine tuning and adjustment through a voice training are necessary to improve the quality of the singing voice. It is obvious that the quality of the singing voice is influenced by aesthetic, cultural, and educational factors. But we think some aspects of voice quality are measurable by means of the acoustical analysis.
In addition, there is a clear need to measure and to characterize the quality of the singing voice, by means of objective techniques, for educational and training objectives. Voice training is basically done in a private lesson, and the improvement of the singing skill is judged by the subjective impression of the trainers. However, subjective or perceptual evaluation is sometimes not reliable. We think that the objective measurement data can support their judgment and evaluation to much extent.
2005/05/12 Updated