| Japanese | English |
This time, motor performance is diagnosed by the real time analysis. As explained last time, the rotational speed of a motor can be calculated from the delay time of the maximum peak of the autocorrelation function.
| Date: | 19 Aug. 2002 |
| Place: | Apartment (Tokyo, Japan) |
| Microphone: | SONY ECM-MS957 |
| Personal computer: | DELL INSPIRON 5000e |
| OS: | Windows 2000 Professional |
| Software for reproduction: | Windows Media Player |
| Software for Measurement: | Realtime Analyzer of DSSF3 |
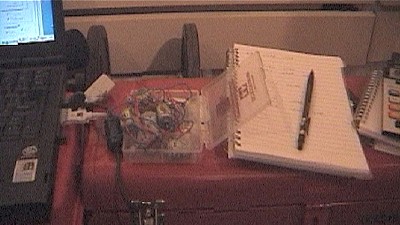
The situation of the measurement.
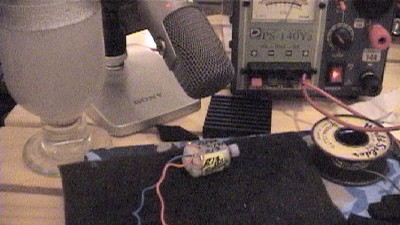
NEW2 motor measured last time is cleaned and measured again.
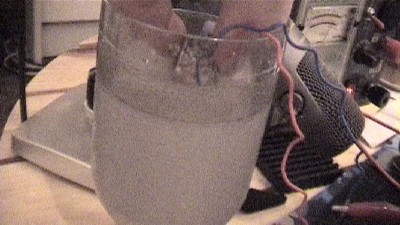
A motor is rotated and cleaned in water.
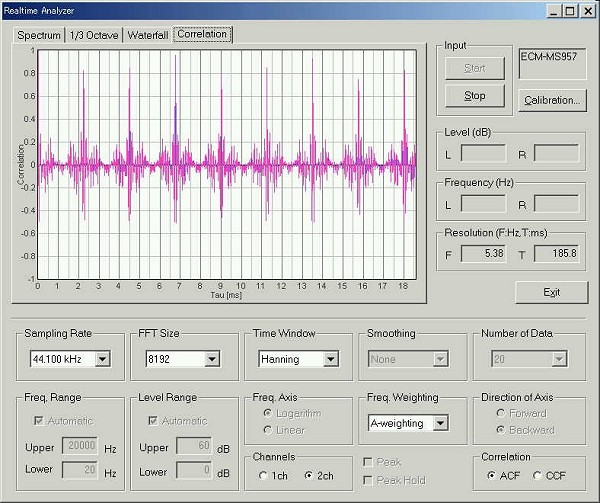
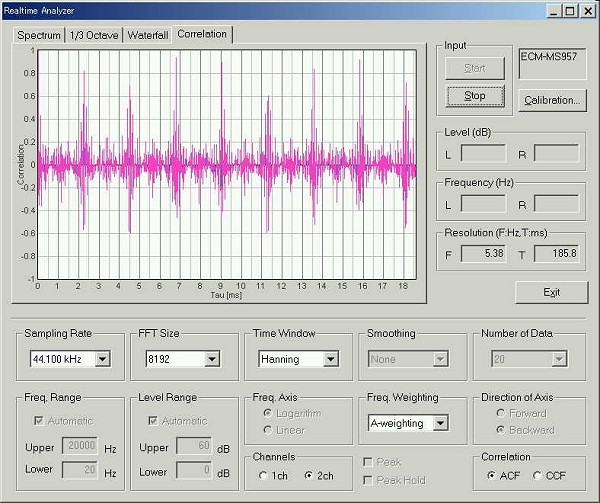
It is the real time display of the autocorrelation function.
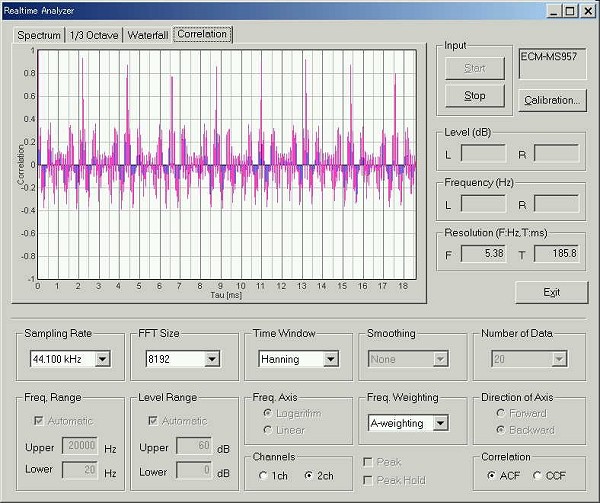
Cleaning changed the waveform of the autocorrelation. Seeing the maximum peak at 2.24msec, the fundamental frequency is 1000 / 2.24= 446Hz. It was 416Hz (2.4msec) before cleaning.
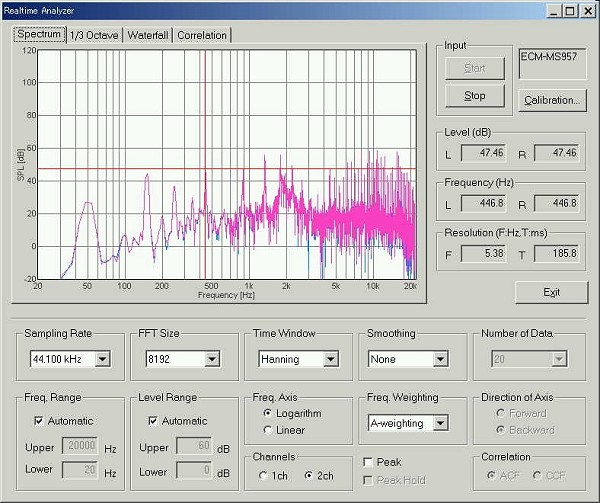
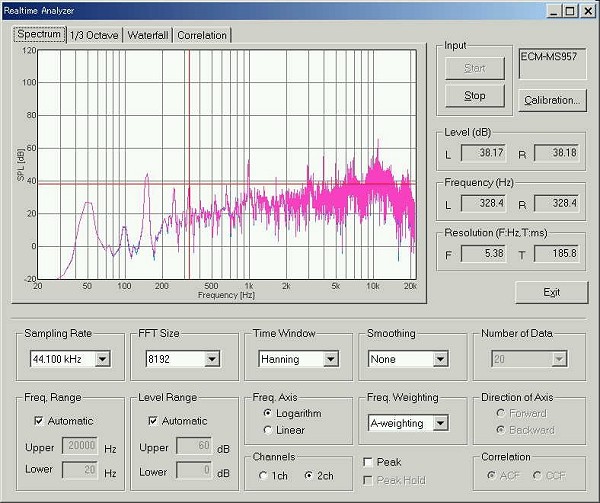
Below is the power spectrum. The peak is at 446 Hz. The rotational speed is 446
* 60 = 26760 rpm. It was 24960rpm last time. Number of rotations increased about
ten percent by the cleaning.
The motor was lubricated, and rotated until it was stabilized. The
autocorrelation changed along with rotational stability.
In the spectrum, a peak is seen at 446 Hz. The rotational speed is same as before.
It seems that rotation does not go up any more.
When the same maker's same type motor is compared, it can be said that the one with higher rotation speed in the same electric power excels in a performance. Conditions of an outstanding motor are: the quality of parts is good, set up is finished finely, there is no loss in operation, and there is little internal resistance, etc. We can say that such a motor has less power consumption and it is with greater workloads (it is efficient and is powerful).
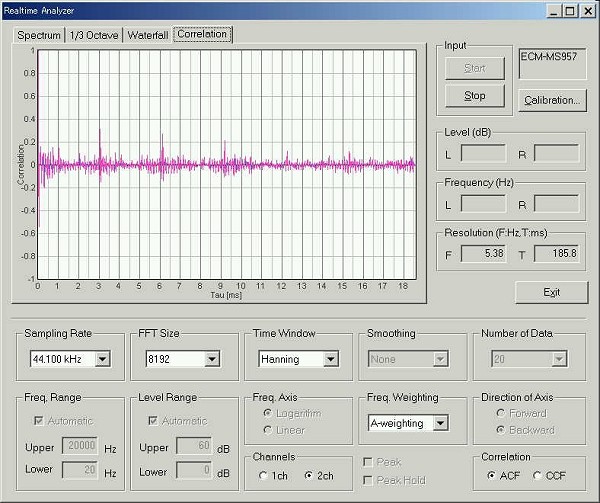
When the inside of a motor becomes dirty with carbon and so, the peak of the autocorrelation will become broad and low. Also, the peak height of the autocorrelation becomes low as the magnet power declines. The R17 motor (it was measured last time) was measured again because I felt that it become old and its power was decreasing.
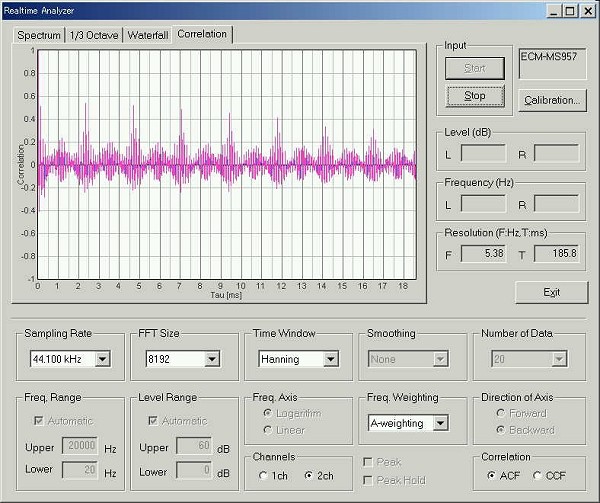
This is the real time display of the autocorrelation function. As I imagined,
the maximum peak at 3 ms is much decreased.
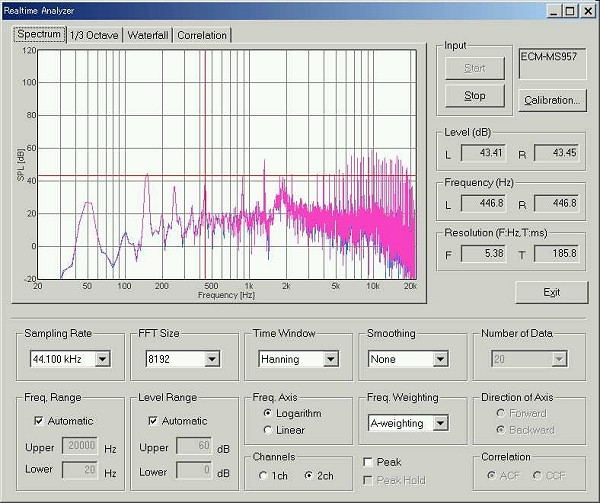
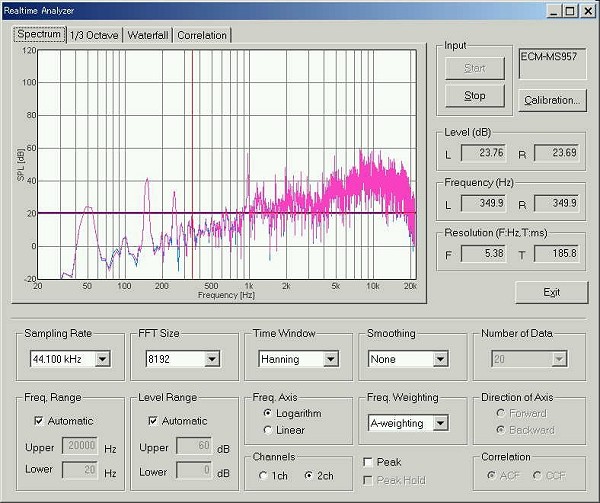
In the spectrum, we can see that the rotational speed is decreased to 349.9
(Hz) x
60 (sec)= 20994 rpm
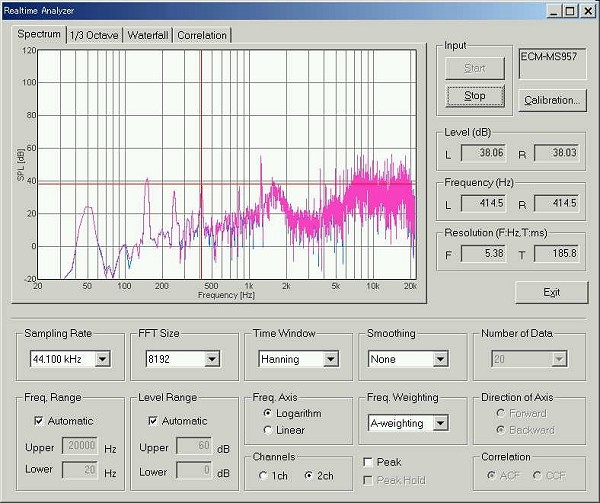
It recovered shortly after cleaning. A remarkable change can be confirmed
by the autocorrelation.
The rotational speed is 414.5 x 60 = 24870 rpm.
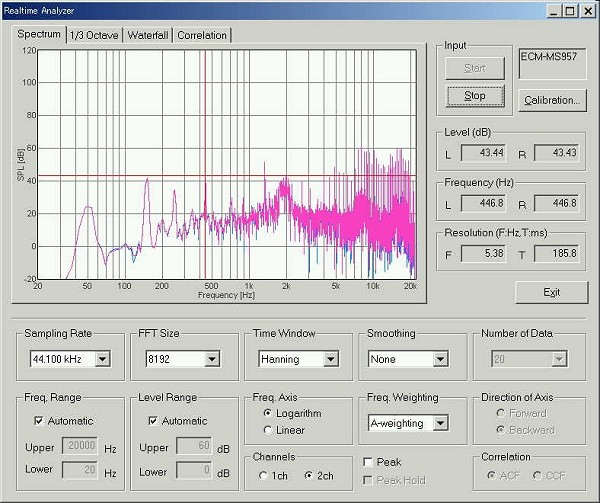
Rotation went up to 446.8Hzx60=26808rpm by lubricating and continuing
rotation for 2 minutes. This seems to be the best condition of this motor.
The autocorrelation function at that time. The waveform shows that this motor is still new (it has not been deteriorated).
The timing of the rotation energy of a motor becomes inaccurate on a time axis by the loss of internal resistance or rotation. By such a time gap of rotation, the autocorrelation decreases and its peak becomes loose. It shows that the power of a motor is decreasing. As for an old and tatter motor, the peak of the autocorrelation becomes extremely small. The R13 motor used in the last experiment is the good example. The last measurement value is 333.8Hzx60=20,028rpm.
The pitch of 3msec can be seen barely.
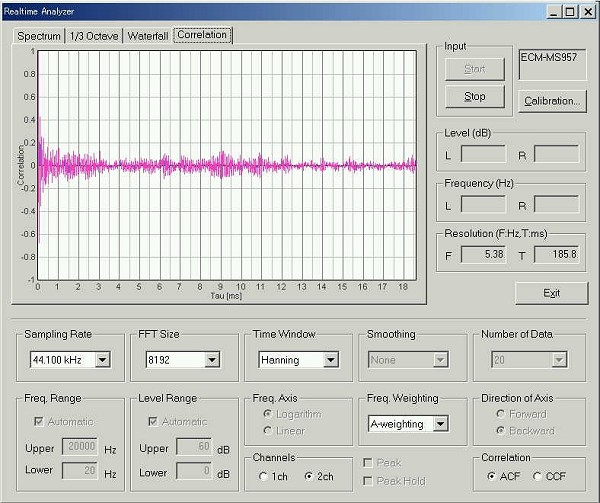
After cleaning, the rotational speed becomes 328 Hz x 60 = 19680 rpm. There
was no effect of cleaning this time.
In DSSF3, the autocorrelation analysis can be performed in addition to the spectrum analysis. Autocorrelation is the time domain analysis that is capable of detecting the periodic events better than the conventional frequency analysis. This is the reason why we apply this method to the analysis of sounds emitted from motor, car engine, and other equipments and machinery. Of course, the autocorrelation is a good analysis method for musical instruments and voices, because most sounds are periodic or quasi-periodic in nature.
August 2002 by M. Sakurai