| Japanese | English |
This time, I try auscultation of neck. Much information is included in the sound of neck.
On the contrary, such a sound cannot be heard if it is a normal blood vessel. Probably, those who have experienced cerebral infarction, and who with the high danger of cerebral infarction, it is good to be auscultated at the time of a medical examination. If abnormalities are not found in auscultation, it is said that other inspection is unnecessary.
Tracheal sound was measured by a handmade stethoscope microphone as same as the heartbeat measurement. The stethoscope microphone was attached to the side of the Adam's apple. Care was taken not to make a noise. The subject closes his mouth and is breathing slowly through the nose.
| Date | 9 Apr. 2003 |
| Place | Home |
| Subject | 50 years old man |
| Microphone | SONY ECM-T150 Electric Condenser Microphone (Dimension: Diameter 6mm / Length 12mm) |
| Amplifier | SONY DAT WALKMAN TCD-D100 |
| PC | DELL INSPIRON 5000e |
| OS | Windows 2000 Professional |
| Software | DSSF3 |
| Other equipment | Stethoscope |
| Setup |  |
| WAVE file |
This is the peak level monitor at the time of no signal.

This is the background noise level measured with all equipments working and no input signal. It seems that the stethoscope microphone has high sensitivity. The level is between -28 and -35 dB.

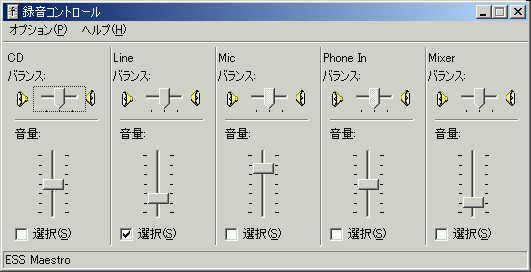
This is the Windows volume control.

This is the input volume control. Line is checked.
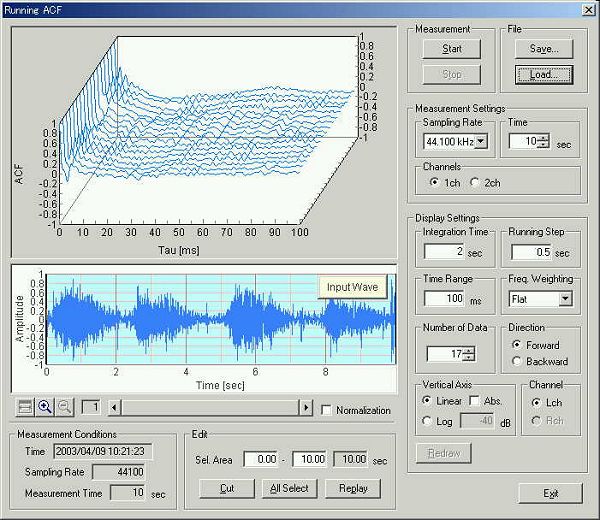
This is the running ACF measurement window. Click the Start button to measure the input signal from the microphone.
Then click the Save button. The "Save Measurement Data" dialog appears.
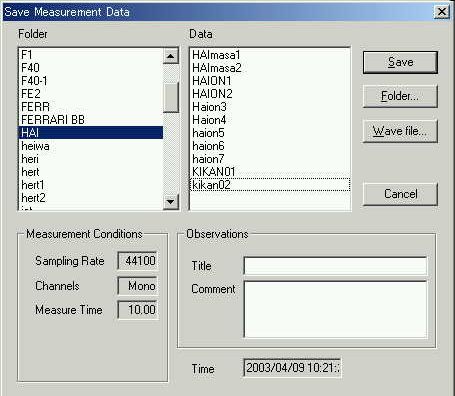
Measured data can be saved as the .wav format. The saved wave file here is a monaural data with 44.1 kHz sample rate.

Wave file can be loaded from the running ACF window. Click the "Load" button and select the "Wave file". Sample data used in this page is here. Right click the link and save in the arbitrary directory.
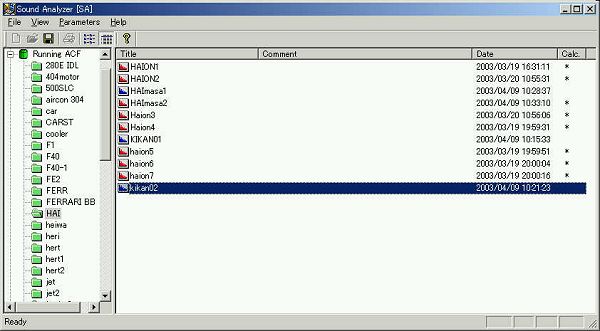
Saved data is loaded by SA.
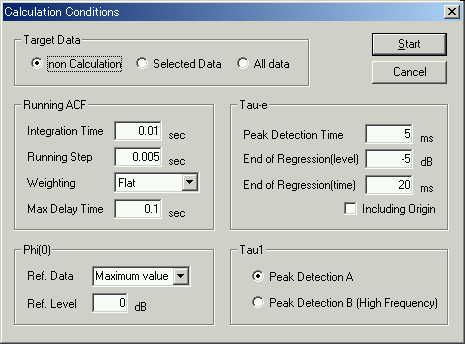
This is the calculation conditions window. Conditions are set for the high temporal resolution analysis.
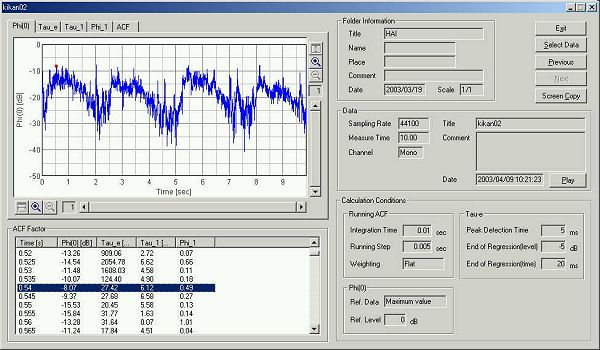
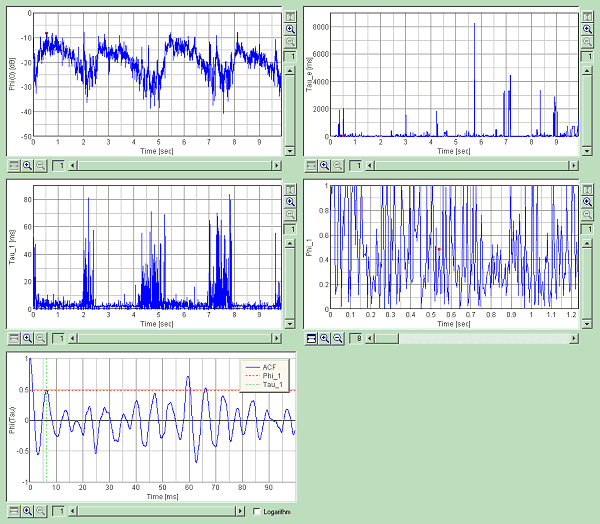
This is the analysis result. The graph Phi(0) shows the time course of the sound level.
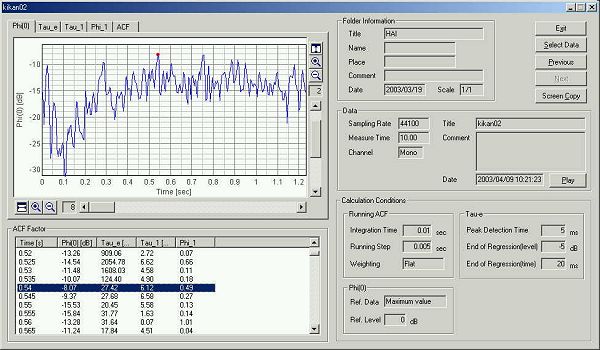
The graph above is zoomed in at the first 1 second. The lung sound is repeated like this waveform.
Time course of the acoustical parameters calculated from the ACF are shown below. This graph image is created by clicking the "Screen Copy" button.
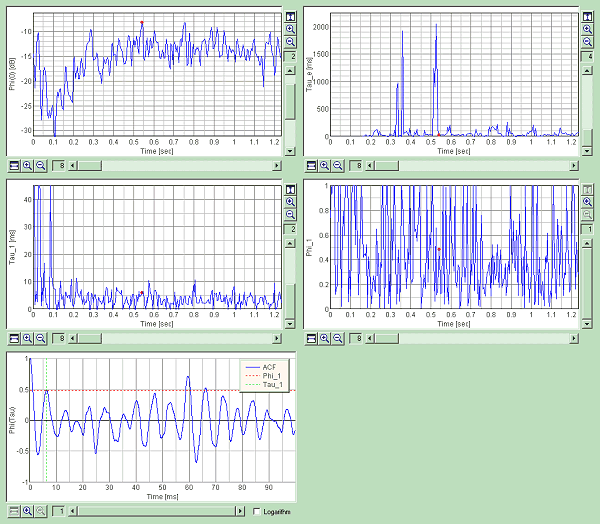
This is the time course of the ACF parameters for 10 seconds.
April 2003 by Masatsugu Sakurai