| Japanese | English |
A measurement point is just beside the runway at the northernmost end of the Nagoya airport. Video camera was set in the direction that looks at southwest from the east side of the airport.
| Date | 27 Feb. 2002 13:10 |
| Weather | Cloudy |
| Temperature | 18 degrees centigrade |
| Humidity | 48% |
| WAVE file: |
Background noise level is 48-50dB.
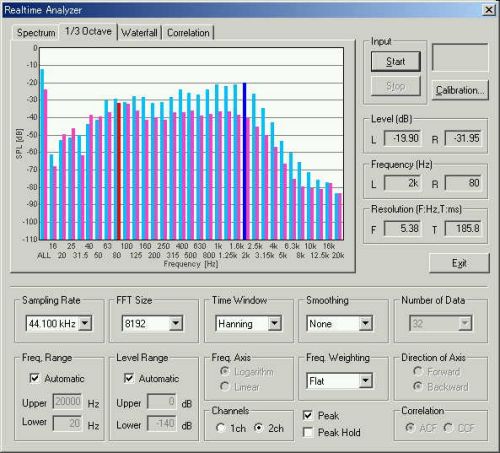
The 1/3 octave analysis and the peak level display of a jumbo jet passing through.
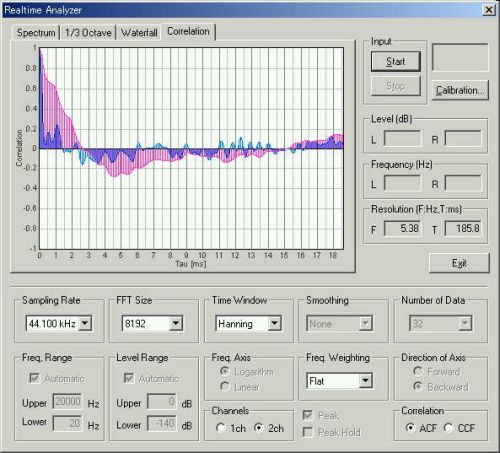
Real-time display of the ACF.
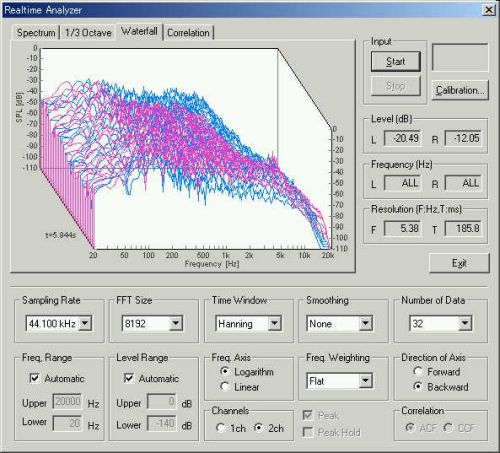
Time-frequency display of the power spectrum.
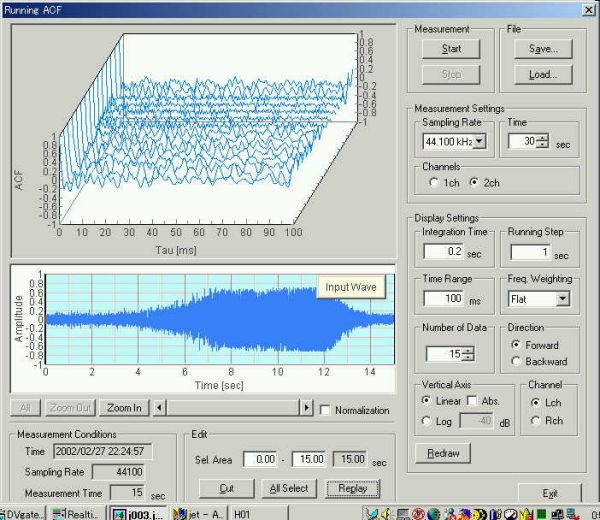
Running ACF measurement with the 0.2-second integration time for 16 seconds. The
graph below shows the sound waveform.
Read the data for the analysis by SA (Sound Analyzer).
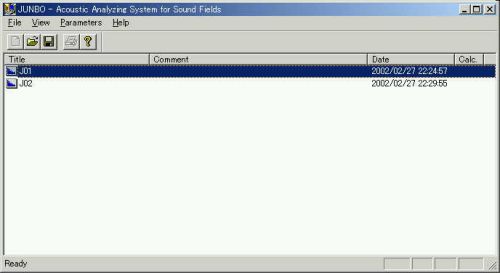
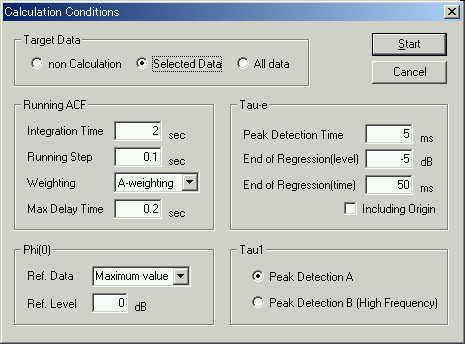
Calculation with the 2.0 sec integration time. It took 11 minutes.
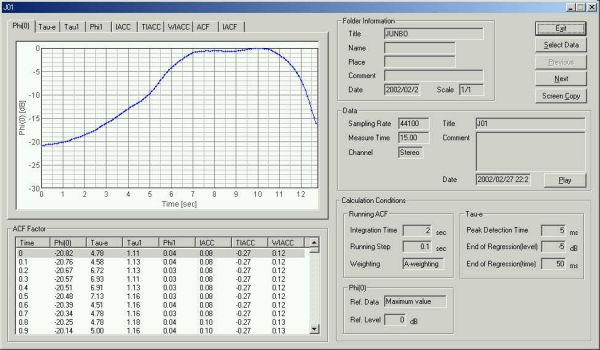
Here are the results. Time change of the sound level. In this graph, the
sound level is shown as the relative level. The actual maximum level
was 105 dBA according to the sound level meter.
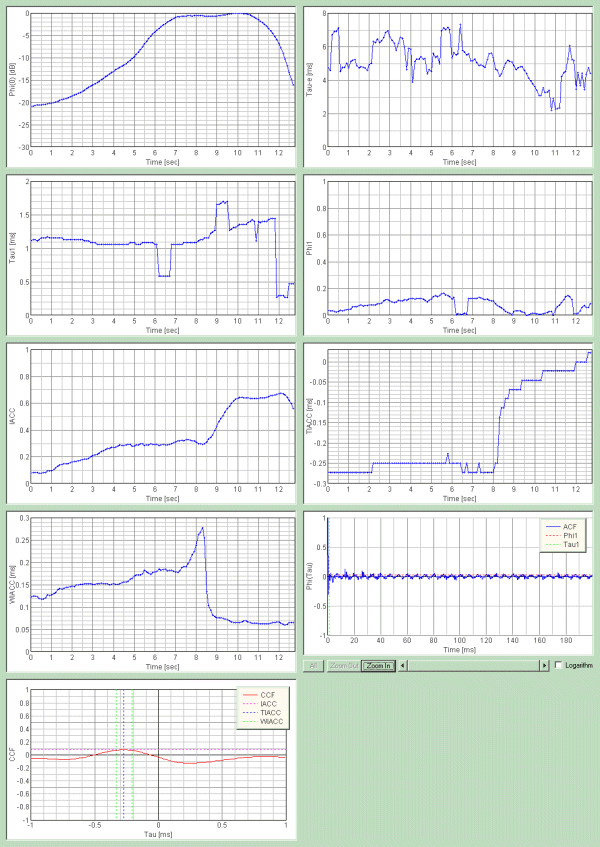
Other results are shown.
January 2002 by Masatsugu Sakurai