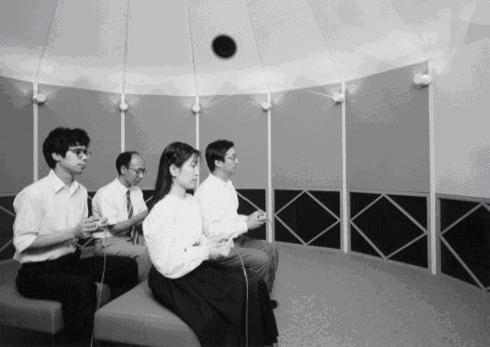
Subjects in the listening room
| Motif | Name of motif | Composer | Source | Track | Ts | Td | te | [Dt1]p | [DTsub]p |
| 1 | Royal Pavane | Gibbons | 1 | 1 | 0.0 | 7.9 | 127 | 30 | 1.75 |
| 2 | Sinfonietta, Opus 48, IV | M.Arnold | 1 | 2 | 0.0 | 6.3 | 54 | 21 | 1.2 |
| 3 | Piano, Classical Mood | - | 2 | 1 | 135.0 | 7.6 | 119 | 23 | 1.4 |
| 4 | Female Chorus Standard | - | 2 | 15 | 0.0 | 7.2 | 33 | 26 | 0.8 |
| 5 | 'Water Music' Suite VI | G.F. Handel | 3 | 24 | 0.0 | 7.9 | 62 | 25 | 1.5 |
| 6 | Jazz, Ensemble | - | 3 | 35 | 7.0 | 6.0 | 49 | 38 | 1.1 |
| 7 | Marriage of Figaro Overture | W.A. Mozart | 3 | 25 | 7.0 | 8.4 | 55 | 22 | 1.2 |
| 8 | Flute, Classical Mood | - | 3 | 31 | 0.0 | 8.1 | 40 | 32 | 1.0 |
| 9 | Cello, Solo | - | 2 | 10 | 199.0 | 8.0 | 234 | 23 | 1.4 |
| 10 | Violin, Solo | - | 3 | 30 | 0.0 | 7.1 | 114 | 22 | 1.3 |
| 11 | Clarinet, Solo | - | 2 | 11 | 0.0 | 7.2 | 65 | 26 | 1.5 |
| 12 | Trumpet, Solo | - | 2 | 8 | 61.0 | 8.6 | 35 | 28 | 1.6 |
|
|
|||||
| LL(dBA) | 70 | 75 | 80 | 85 | 90 |
| Dt1(ms) | 5 | 10 | 21 | 42 | 84 |
| Tsub(s) | 0.3 | 0.6 | 1.2 | 2.4 | 4.8 |
| IACC | 0.4 | 0.75 | 1.0 | ||
|
|
|||||
4.4. Examples of Individuals
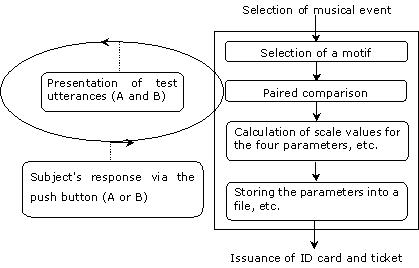
Subjective Preference by the Paired-Comparison Tests
Examples of the concert-goer's preferences
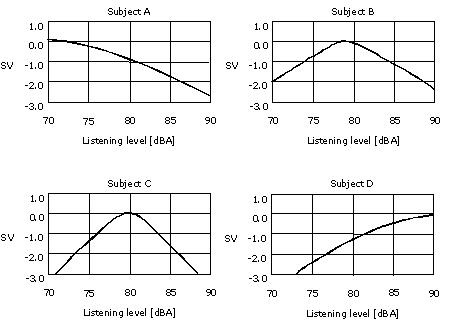
Figure 4.5 shows samples for measured preference curves of
four subjects for the listening level parameter. This shows that the peak and
curvature of the preference curves are individually different. This indicates
that people have strong preferences concerning sound fields.
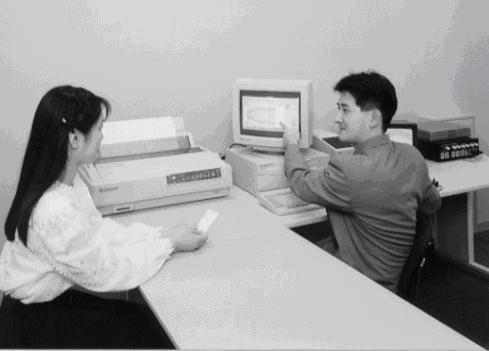
These results are stored into a file on the database for
concert-goers. Then an individual ID card is issued.
Figure 4.5. Measured preference curves of four subjects for listening
level.
4.5. Application of subjective
preference theory for a Seat selection system
A selection system was introduced to maximize
the preference of each individual with respect to the sound field as described
by the four acoustic factors. Preference tests were performed in a listening
room simulating the sound fields with multiple loudspeakers installed in the
Kirishima international concert hall. Suitable methods can be to use either the
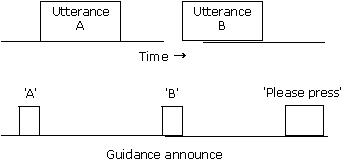
paired-comparison test or a method of adjustment by the listener, or a combined
method that obtains the most preferred combination of LL, Dt1,
and Tsub. To examine the preference as a function of the IACC, only
the paired-comparison test is applicable, because a smaller value for the IACC
is always preferable. Preference tests were performed using several music
motifs. Since it is assumed here that there is no effect of the order of
presentation, the test sound fields were tested using a total of thirty-three
pairs, with five levels of LL, Dt1, Tsub,
and three levels of IACC. The duration of each stimulus is about 10s. It takes
about 15 minutes for each listener.
Scale values of individual preference as a function of each
physical factor were obtained by the simplified method given in [34].
An area of seats where individual preference is maximized can be found. The
large individual differences in the most preferred listening level are at least
partly related to the individual hearing level. The preferred initial time delay
and the preferred reverberation time are associated with an individual
preference for ''liveness". Generally, the preferred values of LL, Dt1,
and Tsub for each individual are quite different, but all of the
subjects tested always preferred a small value of IACC.
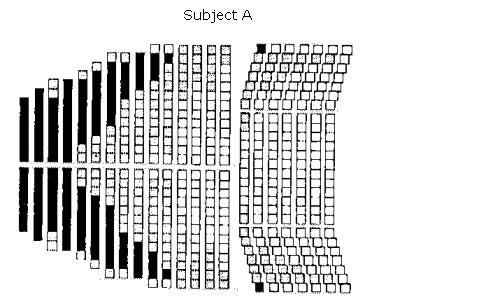
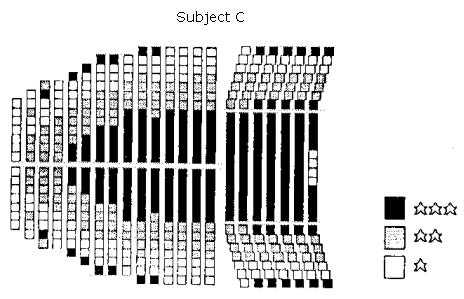
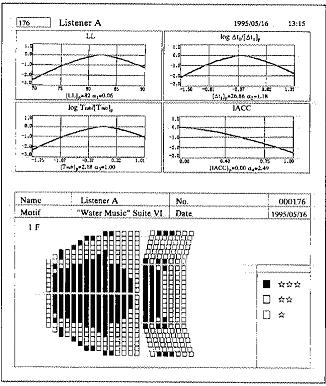
Examples of preference-test results for three individuals
using Suite VI from the 'Water Music'' by G. F. Handel (te
= 62ms) are shown in Figure 4.6. Listener A shows a preference similar to the
global preference for each factor.
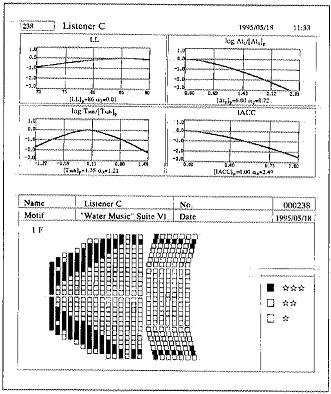
Figure 4.6. The results of preference tests and preferred seats graded into three levels: Listener A, B, C.
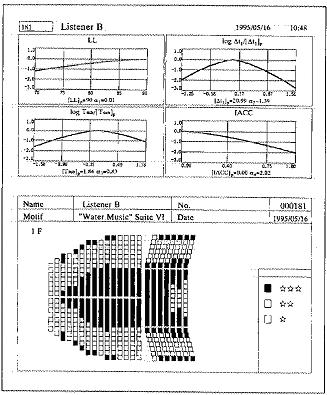
Listener B is recommended to sit close to the stage because he prefers a high
listening level. The listening level is designed to be nearly constant
throughout the hall; however, a large variation in the listening level may be
useful for meeting the large range of individual preferences in listening level.
Listener C is recommended to sit near the side walls because he prefers a short
initial time delay gap. The preferred value of each physical factor is very
different. The range of preferred listening level, for example, is much greater
than 20 dB (A) due to the individual difference of the hearing level. With
regard to the reverberation time, the range of preferred value is 0.5-4.5 s [35].
The initial time delay gap also has a great range of preferred value. To
maximize the individual preference, such facts must be considered.
The results of the preference tests for each individual have
been discussed in terms of the inter-individual differences [36].
The investigation shows that subjects with small inter-individual difference
have critical preferred value indicating large values of ai
in equation (6), chapter 1. On the other hand, the preferred listening level for
the subjects with small values of ai are
barely determined.
4.6. Remarks
The individual subjective preference may be
met using the seat-selection system based on the four orthogonal physical
factors of the sound field for each seat. Examples of scale values obtained by
preference tests and the results of seat selection to maximize individual
preference are demonstrated.