[Dt1]p
 (1 - log 10
A)
(1 - log 10
A)
(2)
|
LL = 10 log ( 1 + A2 ) - 20 log d0 - 11 [dB], |
(1) |
|
[Dt1]p
|
(2) |
|
(3) |
|
[Tsub]p |
(4) |
|
S |
(5) |
|
si |
(6) |
| Factors | LL | Dt1 | Tsub | IACC |
| LL | --- | Ando & Okada | None | Ando & Morioka [17] |
| Dt1(SD) | --- | Ando, Okura & Yuasa [14] | Ando & Imamura [18]; Ando & Gottlob |
|
| Tsub | --- | Ando, Otera & Hamana [20] |
| i | xi | ai
|
|
| xi >= 0 | xi < 0 | ||
| 1 | |||
| 2 | |||
| 3 | |||
| 4 | Interaural crosscorrelation (IACC) | - |
Physiological responses to sound fields
It is quite natural to assume that subjective preference is
reflected by brain activity or physiological responses.
The relationship between the slow vertex response (SVR) and
subjective preference has been investigated systematically [24].
The SVR was recorded by averaging the evoked potentials responding to auditory
stimuli, such as clicks, noise and speech. An adjustable test stimulus was
presented alternately with a reference stimulus. The pair of stimuli was
presented 50 times to integrate and average the evoked potentials, and the SVRs
were obtained from the left and right temporal area (T3, T4:
according to the International 10-20 system [25]).
The results show that the latency of N2-components, that is, the
interval between the time the stimulus was presented and the time of the second
negative peak of the SVR, corresponded significantly to the subjective
preference for changes of the sensation level SL, the delay time of single
reflection Dt1, and the IACC, respectively
[24, 26, 27]. The longest
latencies are always observed for the most preferred condition, revealing that
most of the brain is relaxed under the preferred condition. Furthermore, it is
remarkable that hemispheric dominance appeared in the amplitude of the early
stage of the SVR. In the results the amplitude of A(P1
- N1), Which is the amplitude of the first positive peak to
the first negative peak, shows that the hemispheric dominance differed as
acoustic factors changed. The left hemisphere was dominant when the Dt1
was varied and the right hemisphere was dominant when SL or IACC were varied.
The evoked-potential methods cannot be applied to changes of
the reverberation time with signals longer than 0.9s, therefore a method for
analyzing a continuous brain wave was developed. When a pair of stimuli are
presented, the continuous brain wave can be recorded. The effective duration of
ACF, te, of the a-waves
for the continuous brain wave was analyzed for changes in the delay time of the
single reflection and the reverberation time, respectively. It is noteworthy
that the te of a-waves
are longer only in the left hemisphere for the preferred conditions [Dt1]p
and [Tsub]p [28, 29].
This may be interpreted as being caused by a similar repetitive feature in the a-waves
evoking comfortable relaxation repeatedly in the mind.
Thus, the subjective preference can be traced back to a
imitive response seen as gross brain activity that corresponds well with the
scale value of subjective preference. Also, the evidence indicates that the left
hemisphere dominance of the temporal factors (Dt1
, Tsub) and the right hemisphere dominance of the spatial factors (IACC
and SL) may independently influence subjective preference values [30].
Design process using the temporal and spatial factors
Design procedure
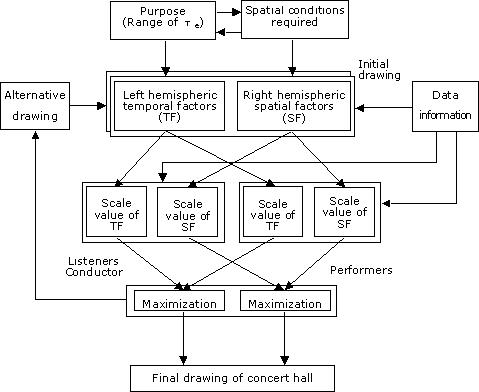
The fundamental concept for the acoustic design of a concert
hall was derived from the above theory and is illustrated in Figure 1.1. The
specialization of the left and right hemispheres for temporal and spatial
factors should be taken into consideration for both listeners and performers.
Alternative drawings, for increasing the scale values of preference, should be
determined using the data information. The first step is to determine the
dominant use of the concert hall under design by selecting a certain range of
the te for the source programs, which
depends on the type of music and its tempo. The second step is to form the
initial drawings of the enclosure so as to optimize the spatial factor IACC. The
final goal is to maximize the scale values of preference for both the listeners
and the performers, and this is reflected in the final drawing of the concert
hall.
Figure 1.1. Flow chart for the design of concert hall